Special Project
Specialist Practice
There are many creatives and many scientists in the world. In previous years these have been seen as separate entities. That is no longer the case. These fields are crossing over at an ever-expanding rate and it is because of some of these mixed media revolutions that I have come to the hypothesis that sound, even as a transparent force, can be captured by a photograph. This work will briefly outline three of the precursor photographers and musicians whose work paved the way for my own
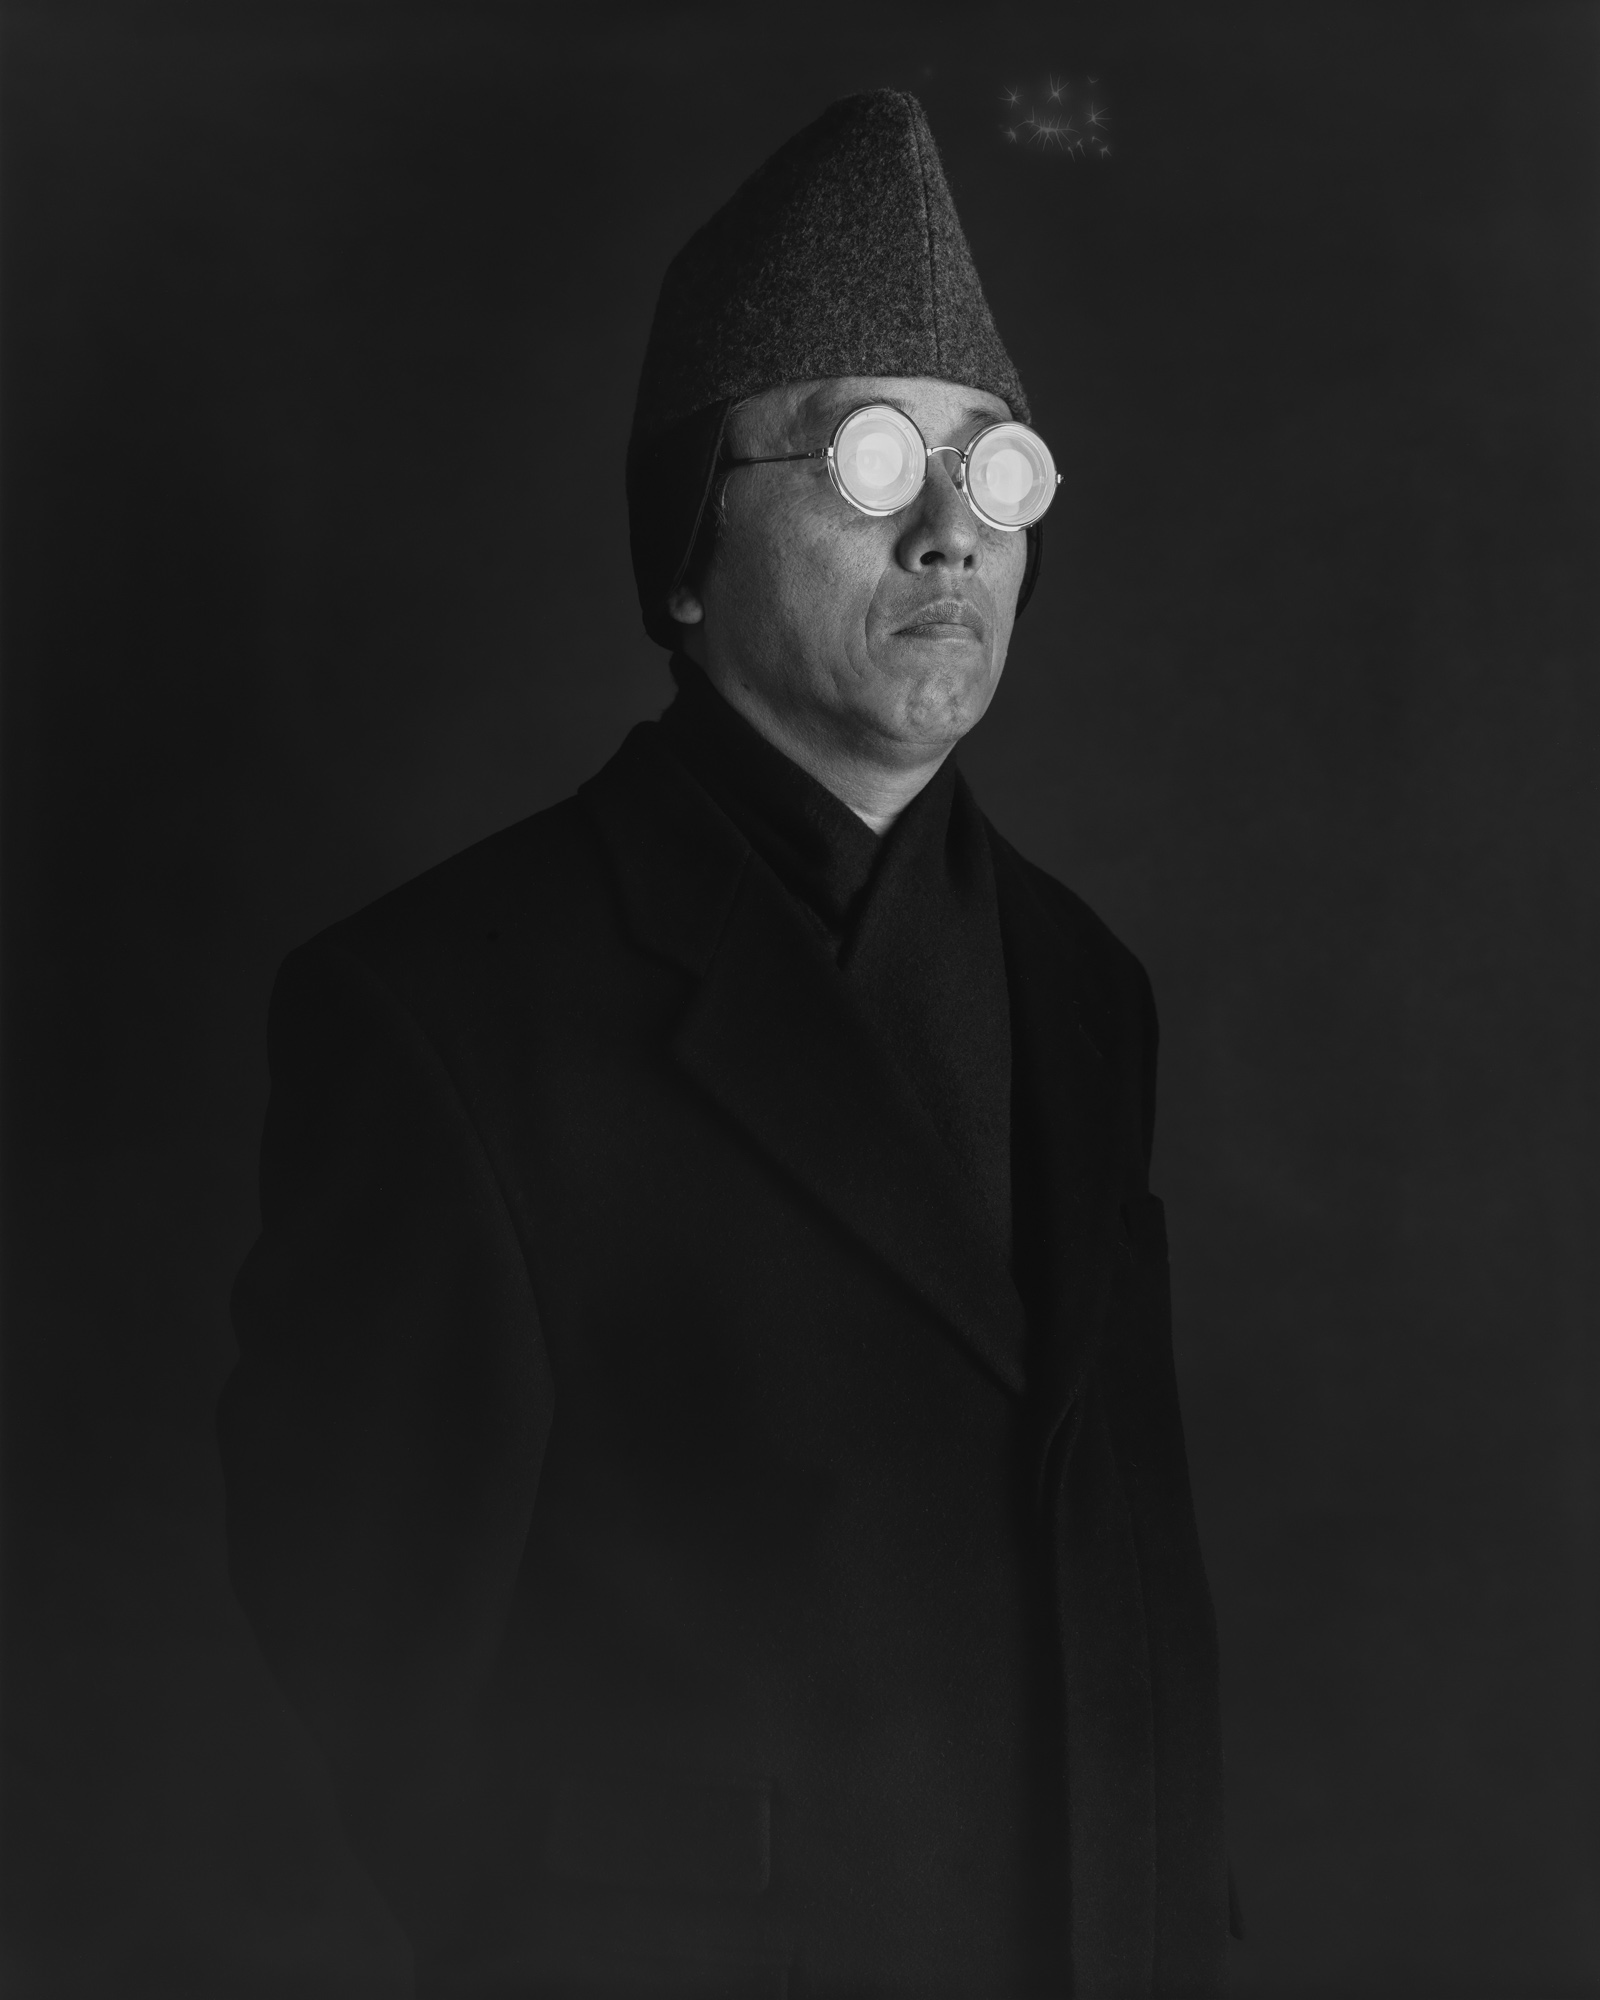 Fig. 1
Hiroshi Sugimoto (fig. 1) is a Japanese photographer, currently studying sociology and politics at the Tokyo Rikkyõ University. Already possessing one degree in Fine Art, he has an extended portfolio of pieces. He works in collections, focusing not only on the small details but limiting his mind to the subject[1]. He works in blocks, the most famous being seascape horizons (fig. 2,3,4). His style is a unique one which has been credited “for its exploration of abstract concepts, such as time, vision and belief[2]” through techniques that promote attention to detail and draw the viewer into consideration of how humanity views itself.
His work aims to create altered states of reality by careful misdirection that uses the passing of time as a medium. Being able to manipulate a non-tangible aspect of his environment with pausing or altering of time in photography helps Sugimoto to achieve his goal. He believes “that the camera can make visible that which the eye cannot see, most notably including time itself and the emotional effects of space[3]”. This is something which can also be applied to the photography of sound.
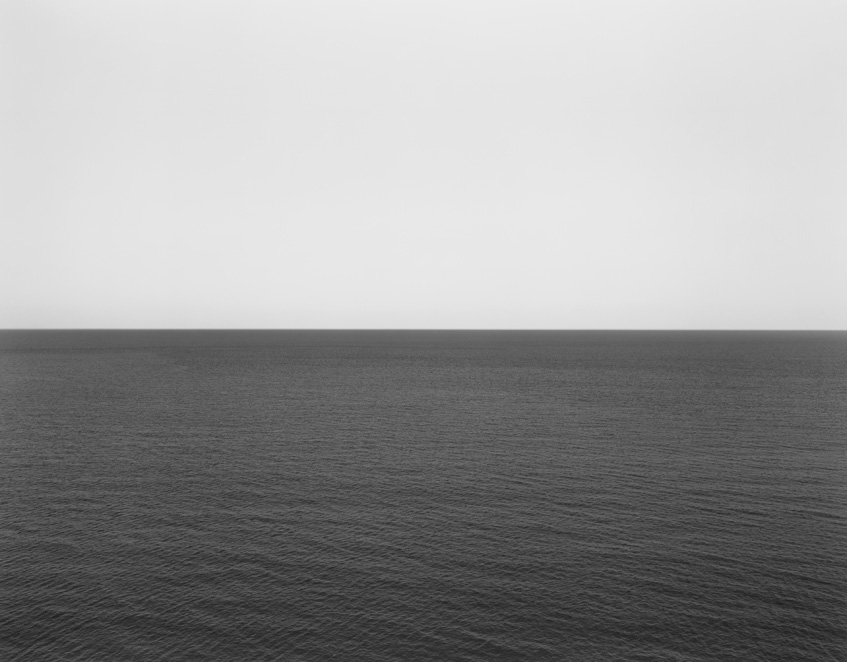 Fig.2
Fig.2 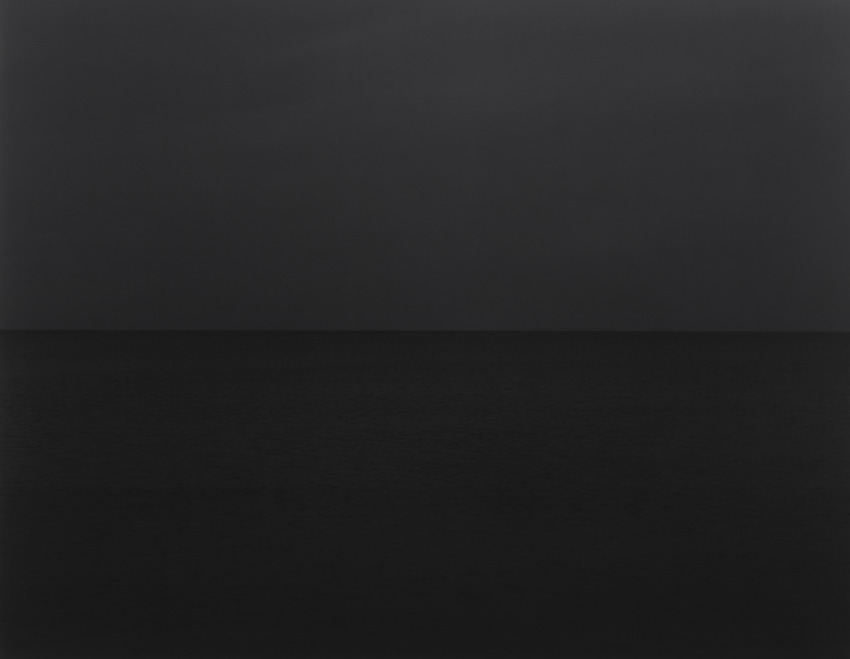 Fig. 3
  Fig. 4
In 2004 he produced “Colour of Shadows”, a project which explores light in a reflective look at the process of photography.
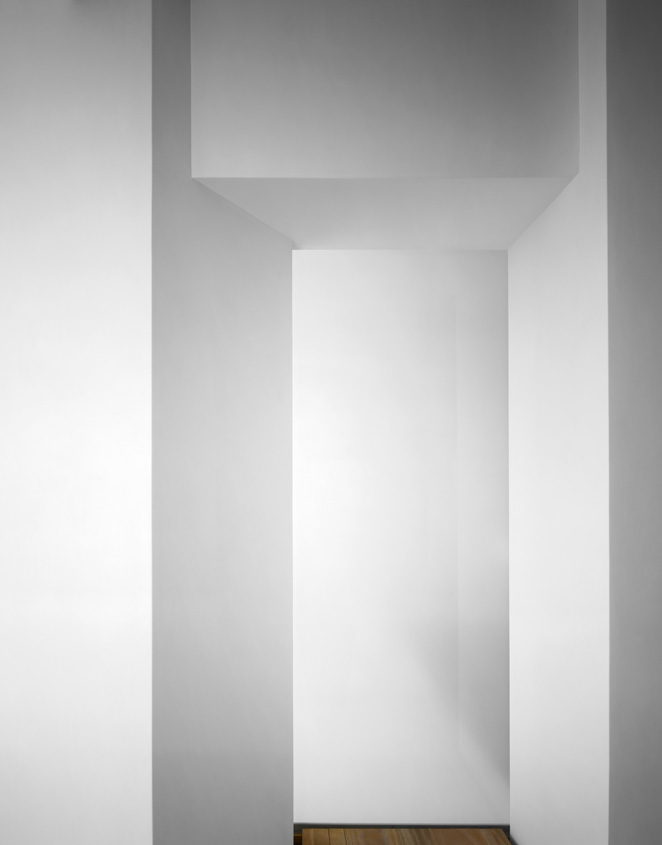 Fig. 5
Image 1015 (fig. 5) from this collection required serious architectural alterations, plastering a hotel corridor and photographing it throughout the day. As only white was used but the angles are still visible the piece draws forth intuitive perceptions of the otherwise impossible site. This allows for sight and individual interpretation of the unseen.
Perhaps even more closely linked to my own study of sound photography is the photographic series of a project called “Theatres”. The monochrome series depicts a full movie in one glance, which becomes a bright screen. It loses its image entirely, but the light alterations remain, producing a whole movie in a single still image. He used his large-format camera to capture the scenery and the projector as a light source. After finding the composition he wanted, he fixed the shutter at a wide-open aperture and two hours later when the movie finishes, he clicked the shutter closed.Sugimoto describes this effect as a “vision exploded behind my eyes[4]”. This was a practice he repeated on several theatres with a range of movies, all rendering the same result. A prime example of which is Carpenter Centre from 1993 (fig. 6) and U. A. Play House, from 1978 (fig. 7)
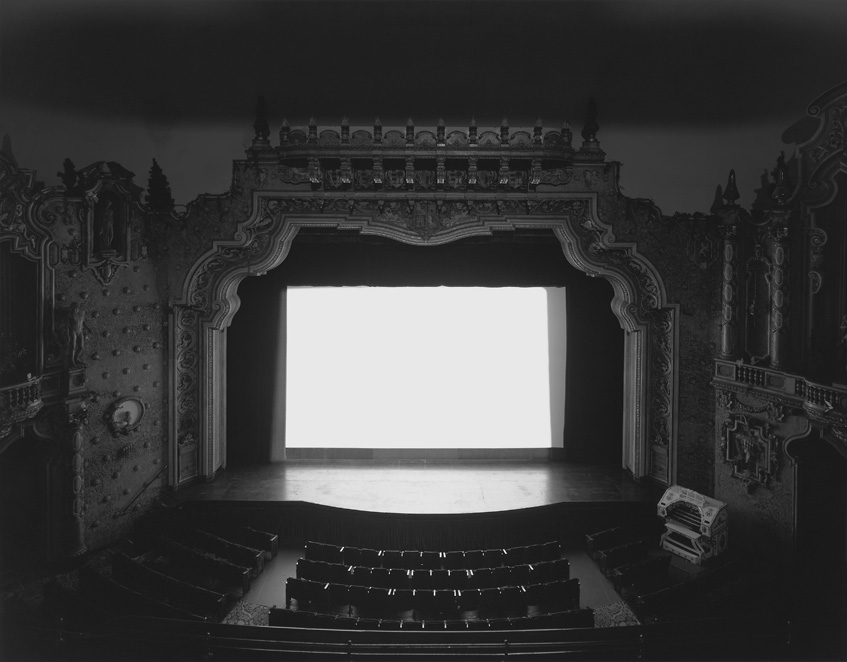 Fig. 6
 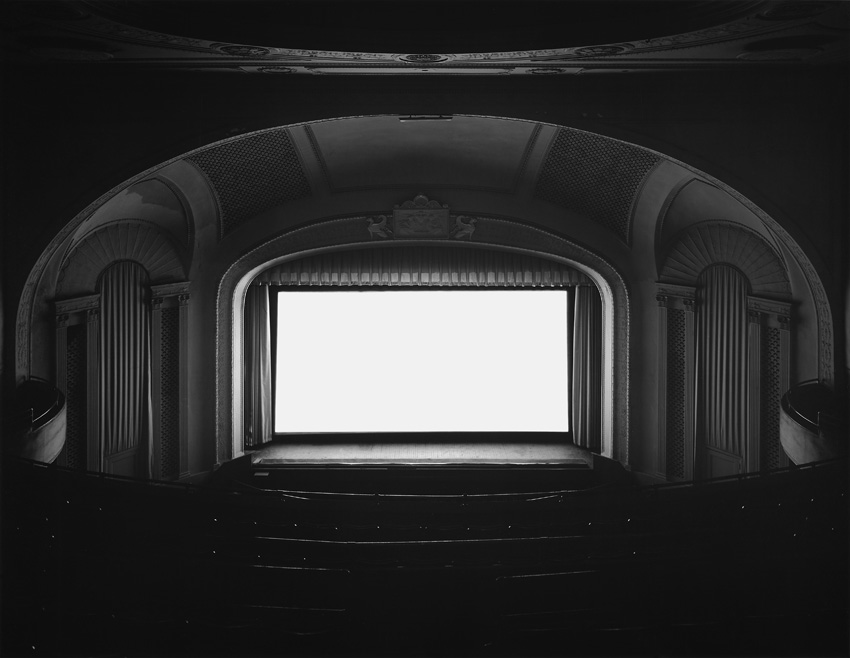 Fig. 7
As I will be photographing frequency, which is another hard to capture firm, the work of Sugimoto was a great inspiration. Taking this one step further his work forced me to approach another angle on top of my existing concept. His use of the same space portraying many dimensions prompted the idea to test multiple frequencies within an image as an advancement of my current project if the results rendered should need further investigation.
For now, the experiment will focus on laser interactions. This will form the foundation of my project and work as a standardised measure for which other variables can be applied, much like the Chladni plate experiment which evolved through different materials and was able to evolve through understanding.
Beyond photography, two main musical influences informed my project. The first was Pink Floyd and the second was the singer, producer and composer Björk.
 Fig. 8
Pink Floyd (fig. 8) was an English rock band who were known both musically for their sound and aesthetically as audio-visual experiment artists. Their work tends to feature philosophical lyrics that stretch boundaries as well as extended composition, sonic experimentation and psychedelic effects. Throughout my life, they have been a source of inspiration and drivers in my desire to think outside the box and see truths only as of the currently accepted theory rather than universal facts. They have intrigued me to question things which are accepted as set in stone but are, at the end of the day, hegemonic theories with the current information at hand. Progressive thinking is a driving force in both science and creativity, and it seems a wonder that these two fields have not intersected more often in the time leading up to this century.
Pink Floyd came to popularity during the 1960s “distinguished for their extended compositions, sonic experimentation, philosophical lyrics and elaborate live shows, and became a leading band of the progressive rock genre”.[5] Their work on audio-visual scenery, combining light and sound to add sensory depth to express their message fully, was a strong inspiration in my decisions to reconsider existing boundaries. One of which was the potential of photographing the so-called invisible.
Their fusion between light and sound to create new results is what my project attempts to do with photography and sound.
When taking an interview discussing the aptly named Sound of Silence tour, the group leader David Gilmour was asked about the “Shrouded by state-of-the-art stage production, where,“the band performs their spacy anthems while obscured by clouds of dry ice and laser technology[6]” (fig. 9,10). He responded that he would not have it any other way. This art of experience translates into a fusion beyond traditional understanding.
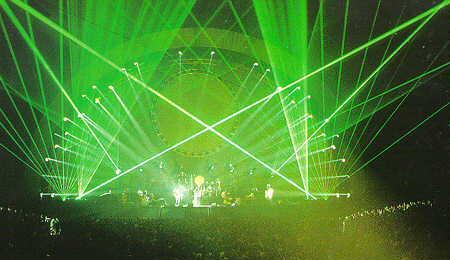 Fig. 9
 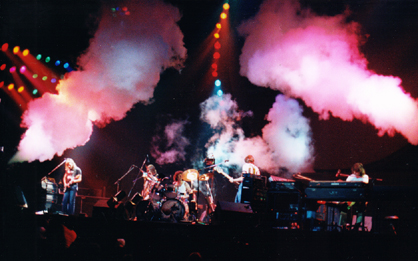 Fig. 10
In another interview, frontman Gilmore said that shows “can be practically spontaneous” [7]showing how the natural vibrations seem to take their course and influence the musician.
It is difficult to put words to something which has not as yet been labelled; however, the inspiration I have taken from the performance art of Pink Floyd stretches beyond academia, much like the emotive experience of their shows. In terms of photographing sound, it has led me to consider the power of senses beyond the standard five. On further research, this was a concept already being scientifically explored. It is now believed that there are 33 senses[8], something which is expanding the way we view the world. The article notes, that where senses were once studied in isolation, there are now practices which show that “Modern cognitive neuroscience is challenging this understanding”, fusing science and philosophy.
Two of the pictures that inspired me to find new ideas and explore even further was the illustration from “the dark side of the moon” (fig. 11) and the photo of the “Meddle” (fig. 12).
The dark side of the moon, Pink Floyd’s eighth album, talks about the philosophical ideas but also the physical ideas that can make a person mentally ill and lead to an incomplete life.
The album consists of two parts: the first part describes a way of life that leads to an incomplete life and the second part the ideas that society imposes on people that lead to madness.
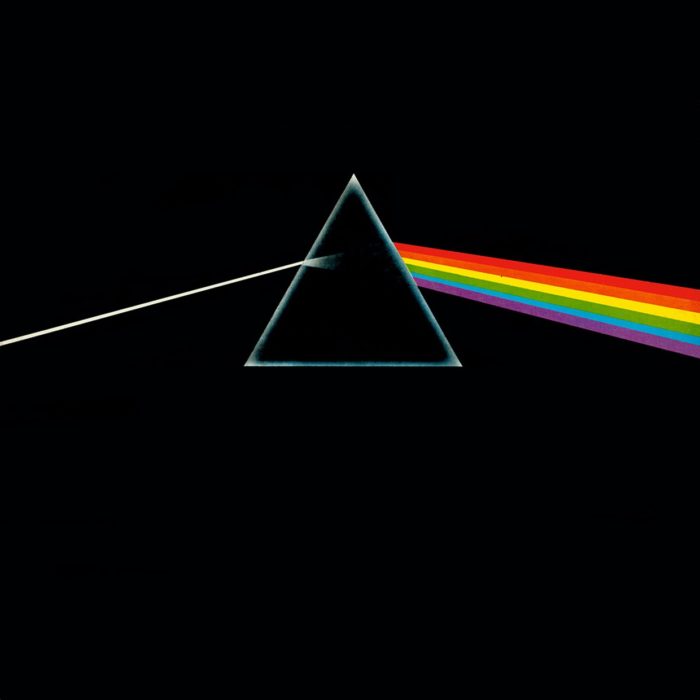 Fig. 11
The cover of the album was created by the English designer Storm Thorgerson in 1973 just before the release of the album. It became one of the most iconic and recognised in the music industry but not only.
A single white-edged translucent triangle centrally placed amidst a completely flat plain of a black background. A thin stream of a white light proceeds from the left and is refracted within the triangular prism, causing a rainbow to be projected to the right.
There are four significant aspects of the cover that one must consider in context with one another.The stream of white light, the projected rainbow, the black background and the triangle.
The most symbolic aspect of the triangle is that it is an equilateral; due to this triangle ideal proportions, it has been used by many ancient civilisations to represent the deity. This perfectly proportioned geometric shape which is both three-pointed and singular has been for centuries in Christian art to symbolise the nature of the trinity.
Furthermore, as the triangle is placed in the centre of the field vertically raised and oriented upward it signifies an utmost of hierarchical meaning and the highest attribute of the highest is god’s role as a creator. Interpreting the prismatic triangle as a creating entity allows for the other three aspects of the cover art to fall naturally into their place. The stream of the white light which sources the sun, a vital motif used throughout the album, symbolises unitary of mind or a singular consciousness.
The refraction light, seen as the projected rainbow, symbolises diversified creation and in Judaeo-Christian tradition goodness. Lastly, the field of black represents the chaos or potentiality the beginning. In summary, the cover art portrays creation.
Storm Thorgerson also said that he wanted to find something to relate the cover to the pink Floyd’s live shows which consist of colourful lasers and smoke.
 Fig. 12
Meddle, Pink Floyd’s sixth album was released on 31 October 1971.
This album was a group effort from the whole band. At that point, they seemed to have no material to work with and they were not sure which direction to look at in terms of the meaning of this album. After experimenting with different musical compositions, the band was inspired to create the twenty-three minutes song “echoes “which can be found on the second disc of the album. This album is considered a traditional album between Syd Barret’s group of the late 60s and the emerging Pink Floyd.
In terms of the cover of the album, its creator Storm Thorgerson revealed that he wasn’t very happy with the results, as his first idea was a close-up shot of a baboon’s anus. The band, however, said that they would prefer to have an ear underwater.
As a result, according to its creator, we see an ear which is underwater (figure 12) and on the top, we can see ripples from drops on the surface of the water which creates circular patterns.The large size ear represents “the musical nature of events “or the “hearing” and the ripples of the water represent the waves of sound.
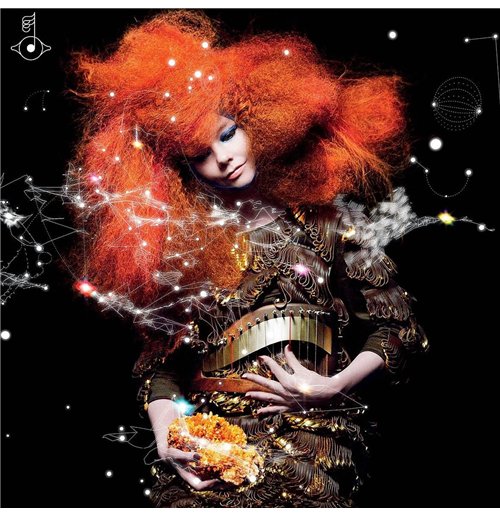 Fig. 13
As mentioned earlier, Björk (fig. 13) was a highly influential sound artist in the development of this project, particularly for her work on Biophilia, released in 2011.
Icelandic sound producer Björk is often known for her aesthetic but at the heart of her creation is “her obsession with patterns and structure and conceptual boundaries[9]”
which delve into the multifaceted realms of what art and the human experience is. Biophilia, known as an “interdisciplinary project”, was called by The Guardian a “pioneer music format that will smash industry conventions”; [10] yet it is more than that, expanding the very basis of human interpretations and how we interact with sound on a contemporary level.
It has long been accepted that music has a physical effect on the body, a thought first established by monks in healing practices. Björk takes this even further by introducing plate tectonics, genetics and human biorhythm into her work. This creates intertextuality between the common and the cosmic. Many have deemed this type of experimentation a fault on the music, but the importance of the sound is so much more than that.
Biophilia is a project which mainly attempts to demonstrate how nature relates to us and music. For instance, how elements in nature can be used in music, how the natural structure can inspire us to create music and how we can visualise music by analysing natural objects.
In the documentary called “When Björk Met Attenborough” (fig. 14) in 2013, when Bjork went to the crystalline room with Sir Attenborough, she explained how the natural structure of the crystalline inspired her and wanted to bring nature in her music.
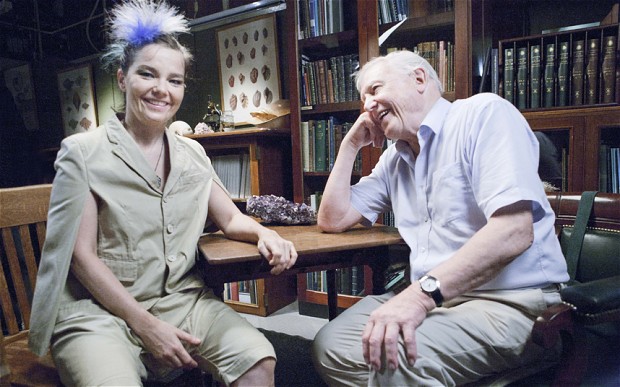 Fig. 14
They were talking about the mathematical thesis of her songs, and Bjork was explaining the time signature of the verse and chorus and how she was comparing the composition of the song to the structure of the crystalline (fig. 15).
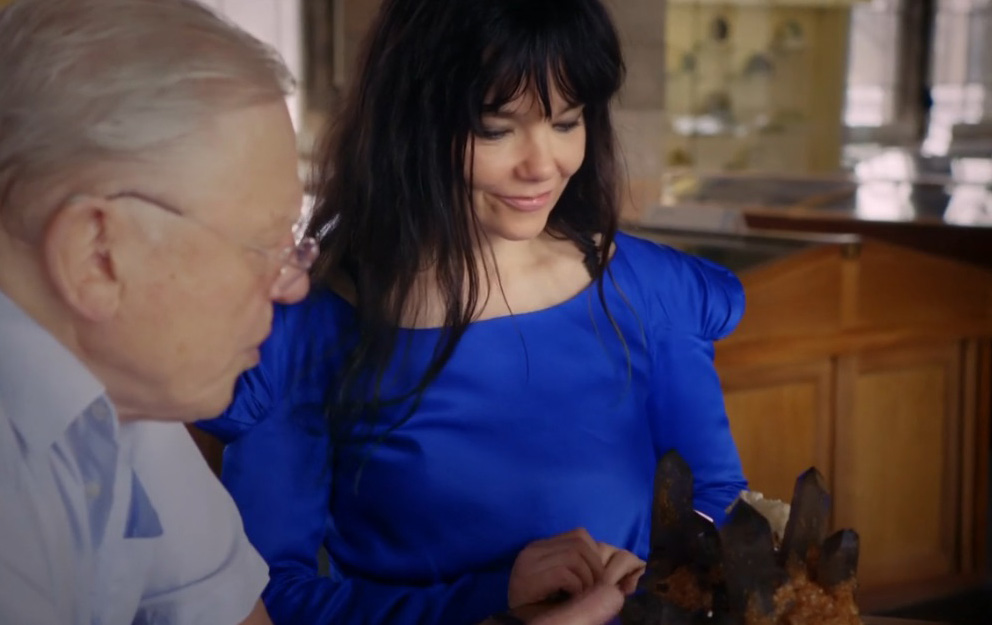 Fig. 15
She stated that people struggle to visualise this, and this is what she wanted to change. Later on, the singer collaborates with Evan Grant who works with cymatics. He explained how the Chladni plate (fig. 16) works and also stated that he really appreciates how Bjork wants to bring a real meaning in her music by taking a “scientific and realistic approach”. Grant uses cymatics in water, and the results can be seen in the music video of the song “Crystalline” (fig. 17).
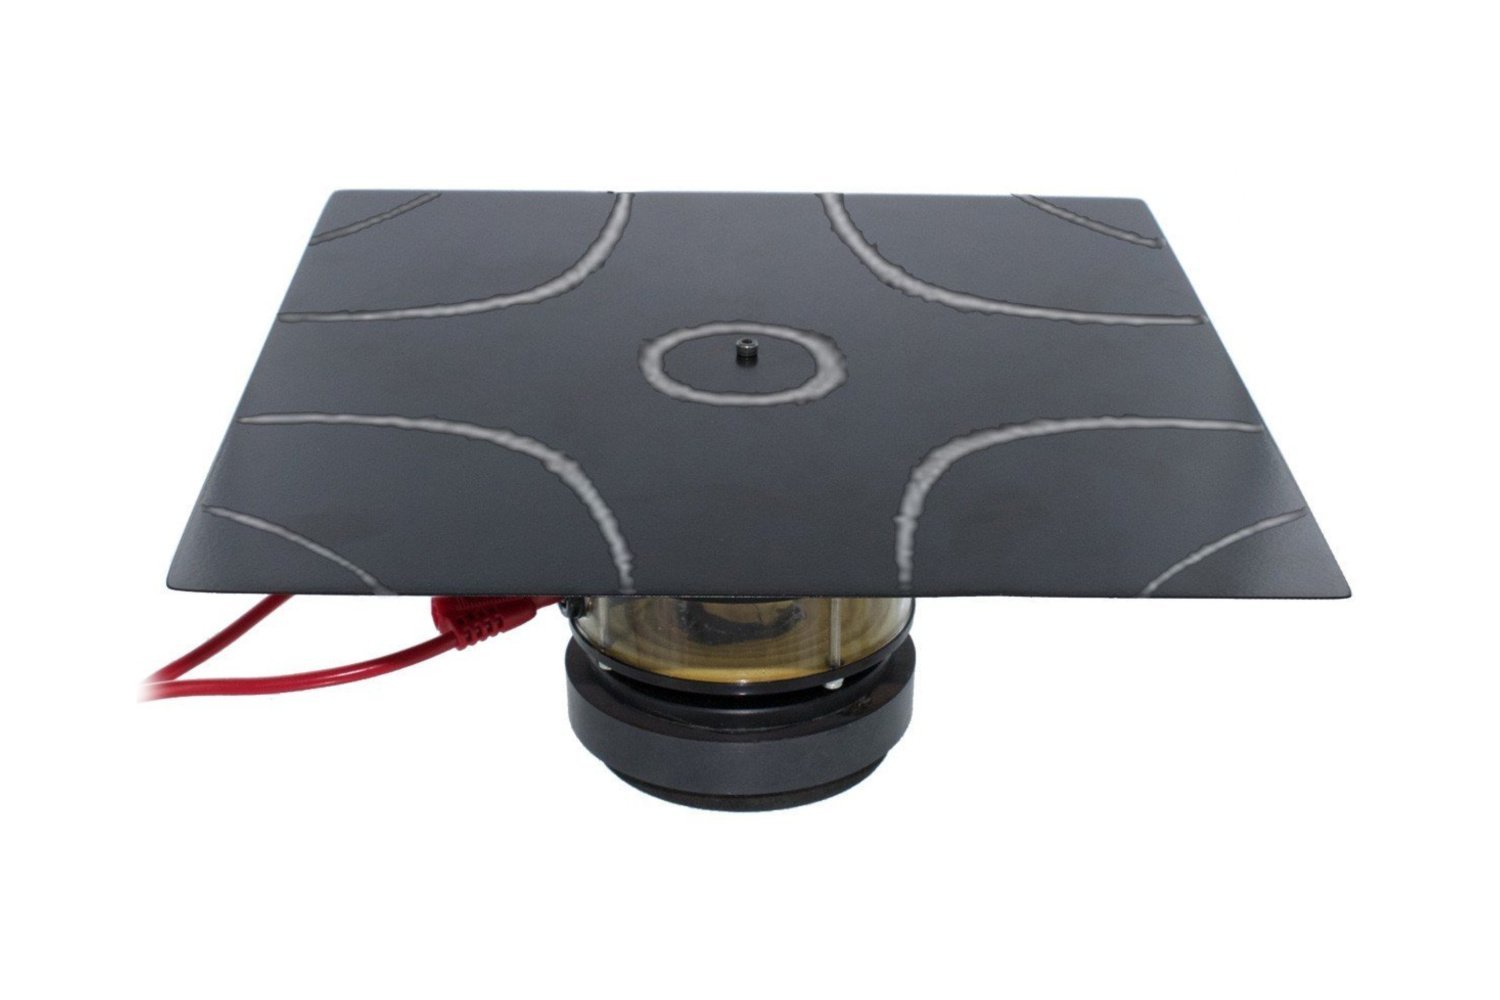 Fig. 16
  Fig. 17
The Icelandic singer and composer Bjork is known as an artist who uses technology to create music. She uses musical software such as Pro Tools, Sibelius and Melodyne but also technology that needs physical reaction to produce sounds, such as touchscreens and music sequencers. The one that got my attention was an instrument called “Reactable” (fig. 18) which was developed as a PhD musical project at Pompeu Fabra University in Barcelona, which Bjork used in her tour in 2007 called Volta.
 Fig. 18
Reactable looks like a high bar table with a translucent Perspex top along with a blue electric light that comes from inside. This musical instrument allows the users to manipulate the sounds by placing different blocks on the surface. The camera which is under the surface allows the instrument to track the movements of the blocks and when rotating them or moving around, it changes the amplitude and tone to create synth lines. Every block has different functions such as changing the sound wave amplitude or acting like a metronome. On top of that, what is more interesting is that the machine allows music to be visualised by producing different shapes while music is being created. (fig. 19) As Pink Floyd’s shows is an instrument that uses audio-visual technology to please our senses.
 Fig. 19
“When I first got it, I thought, ‘Why don’t I just make a funny noise on the Moog?‘” said Damian Taylor, a Grammy-nominated producer who engineered Björk’s latest album, Volta, and who plays the Reactable onstage with the Icelander[11].
Fig. 19
“When I first got it, I thought, ‘Why don’t I just make a funny noise on the Moog?‘” said Damian Taylor, a Grammy-nominated producer who engineered Björk’s latest album, Volta, and who plays the Reactable onstage with the Icelander[11].“Established instruments like the Moog, the turntable and the laptop are really powerful, but they do not provide the necessary control over the complex sound generation in the background,” said Martin Kaltenbrunner, one of the four-man team that created the reacTable.[12]
In conclusion, these three creatives have opened pathways in our understanding of reality and perception. This has led to experimentation between light and sound, which I will be analysing further. This will be done through combining the act of photography (a light-based process) and sound frequencies.
Before explaining my set up and the different experiments that I did throughout this process, perhaps some information about me as well, would explain where my personal interest in this project came from. Additionally, I would like to provide a few technical facts and a few examples of how photographers use mathematical base in their work and how that relates to sound.
About me
My name is Christos Baimpakis and I was born in one of the most beautiful places in Greece, Chalkis, (fig. 20) in 1982
 Fig. 20
At around 16 years old I discovered that I was in love with music and I started to learn guitar. At that point, I put together my first band with nine members which helped me perform many gigs (fig. 21), including some with popular artists. Later I studied music, went to music schools and a few years on, I became a music theory and guitar teacher.
In the meantime, my role in the band was not just a guitar player; I was also the sound engineer (fig. 22) and music producer. As a result, I became very close with sound and everything that surrounds it.
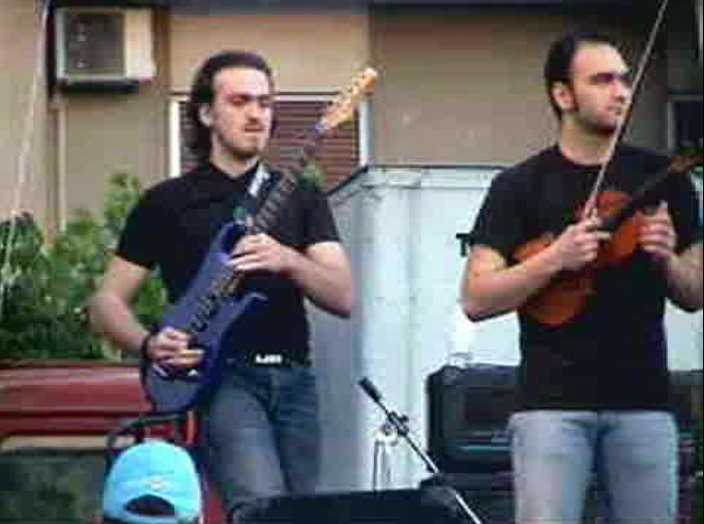 Fig. 21
 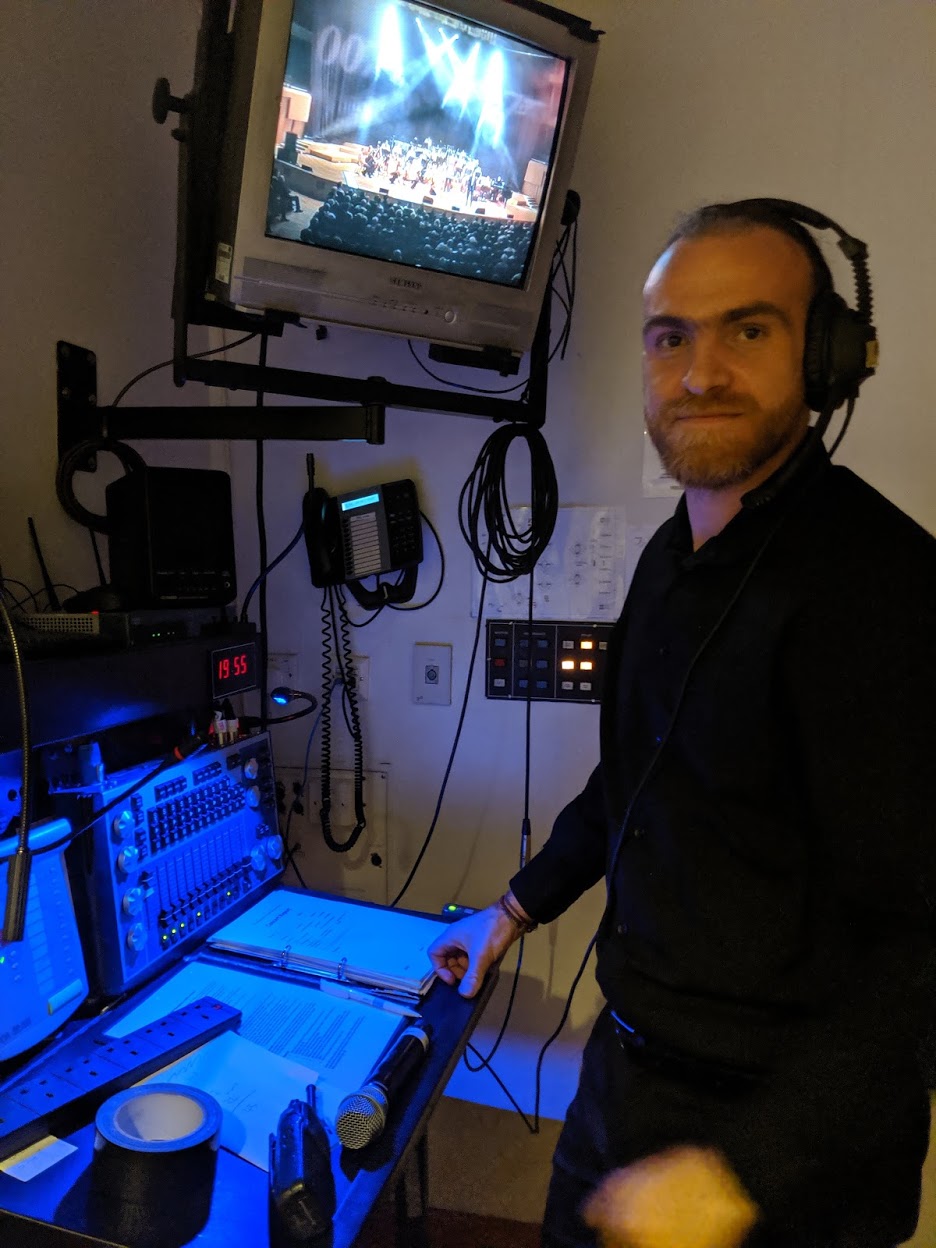 Fig. 22
As far as I remember myself, I always wanted to buy a camera. Just after a few years since I arrived in the UK, I managed to buy my first professional camera. Since then, my relationship with photography got stronger, and I took tutorials and other online courses. What is more, I decided to go to college to spread my horizons and gain more knowledge.
After successfully graduating college, my tutor urged me to go to university: currently I am in the third year of a BA Degree in Photography at the University Centre of Blackburn College.
As part of this course, in one of the first semester modules called Specialist Project, I decided to combine music and photography.
Relationship between music and photography
The connection between music and photography has always fascinated me. Like many, I was deeply exposed to music growing up. As a child, I learned how to play the guitar, often
reconstructing complex melodies in my head.
This was happening for years and although I did not realise at the time, my immersive exposure to music was laying the groundwork for my photography. There was a point where certain questions came to mind:
• Can musical training make you a better photographer?
• Do you often see images when you listen to music or the opposite, hear music when photographing?
• What is it about the two art forms that make them so similar, so complementary to one another?
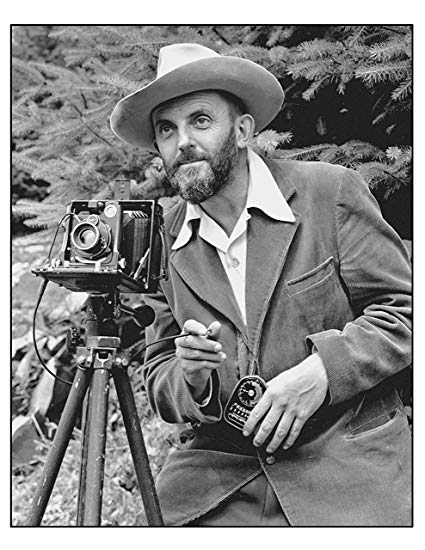 Fig. 23
Ansel Adams for example, (fig. 23) was passionate about becoming a concert pianist. Although in the end, he abandoned his initial aspiration, the piano studies taught him a lot about discipline, accuracy, technique and the immense importance of persistent practice.
In a 1984 interview by Milton Esterow (Editor, ARTnews), Adams said that,
“Study in music gave me a fine basis for the discipline of photography. I’d have been a real Sloppy Joe if I hadn’t had that.” When asked to explain this thought, he added, “Well, in music you have this absolutely necessary discipline from the very beginning. And you are constructing various shapes and controlling values. Your notes have to be accurate or else there’s no use playing. There’s no casual approximation.”[13]
Adams also stated that he would often hear music while photographing:
“You see relationships of shapes. I would call it a design sense. It’s the beginning of seeing what the photograph is[14].”
Fig. 23
“The negative is comparable to the composer’s score and the print is the performance. Each performance differs in subtle ways,”- [15]A. Adams
If we just look at a scene, this only involves the most basic sense of sight. However, to see it requires us to engage all of our senses—to open up to the possibilities of this particular instance. When I refer to senses, I go beyond the five basic ones: seeing, hearing, touching, smelling, and tasting. Despite the obvious debate on this matter, experts sustain that we are also aware of temperature, pain, motion, balance, presence, time, spirit, and intuition.
Adams claimed that “hearing the light” occurs on an intuitive level. In my opinion, this is also the case with other photographers. Intuition, in this sense, is the result to some extent of intense practice and repetition. Subsequently, we escape from the form, and pure expression and spontaneity are left.
It is also believed that there is a link between photography and mathematics. Music theorists describe maths as the “basis of sound” – even though such claims are mainly focused on acoustic rather than compositional matters.
For instance:
Famous street photographer Henri Cartier-Bresson (fig. 24) was renowned for aligning moments along with a scene’s geometry (fig. 25). He employed his keen perception of shapes, forms and –above all, human behaviour- in much of his work. Bresson was also known for integrating the Golden Ratio into his work. (fig. 26, 27)
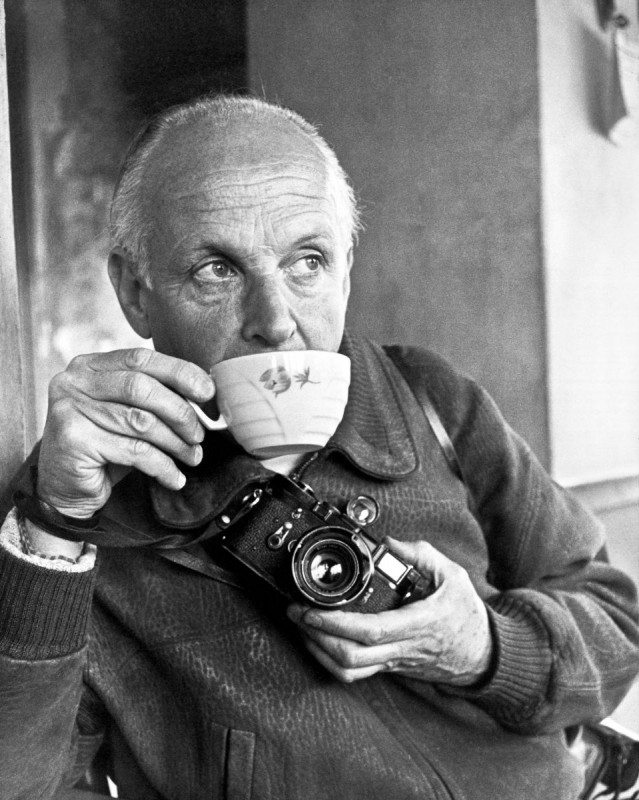 Fig. 24
 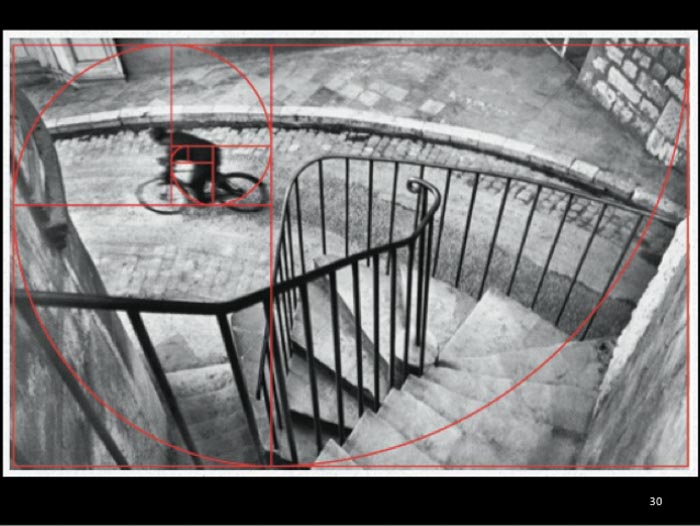 Fig. 25
The Golden Ratio revolves around the concept that there is an ideal arrangement of elements in terms of composition. In other words, by organising the elements in a specific way, the artist reaches the goal of balancing harmony, proportion and symmetry.
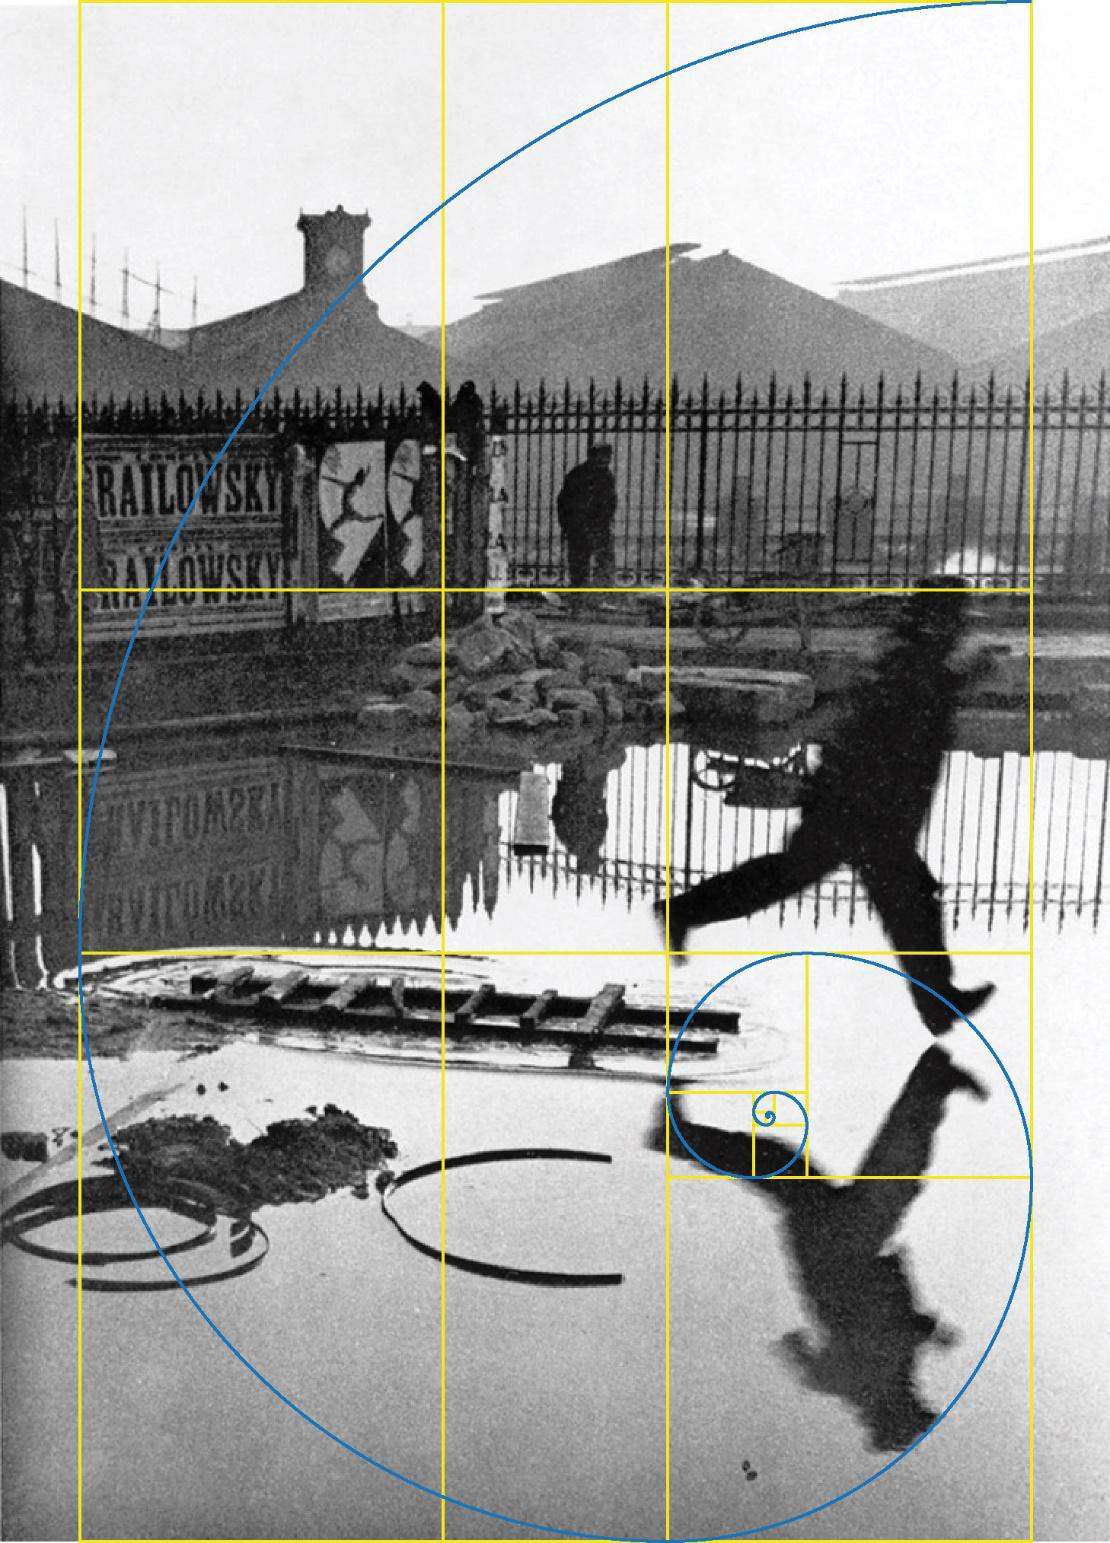 Fig. 26
 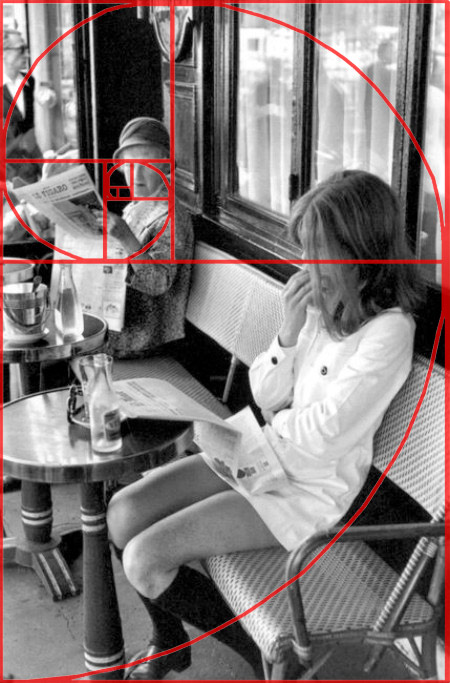 Fig. 27
Music and Photography
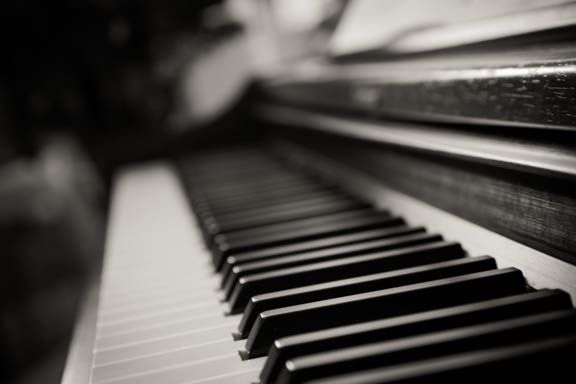 Fig. 28
Although there are different viewpoints regarding this, photographers, as well as musicians, may intent to integrate opposing notions into their work – i.e. hard against soft, motion against stillness, symmetry against asymmetry.
Other common contrasts found in these two disciplines could apparently be perspective, shape, texture, tone, pace, repetition, and balance (and the lack of it): as a unit, each one carries a specific notion; however, when blended in an organic outcome, they provide a complete story.
Photography does not seek to capture a theme as a direct representation, but as a combination of forms, lines, and tones, in order to transmit emotion or even an emotional state. Starting from the idea that the foundation of all photographs is the combination of elementary forms, i.e. squares, triangles and circles), it could be claimed that this also applies to music: a combination of notes, arranged in composition using pitch, rhythm, and texture.
In both disciplines the combination of these elements may lead to expressing a state of mind or emotion, bringing to the surface a particular notion of space and time. In both music and photography, there are common themes that are frequently explored: joy, sadness, solitude, passion, tension and nostalgia.
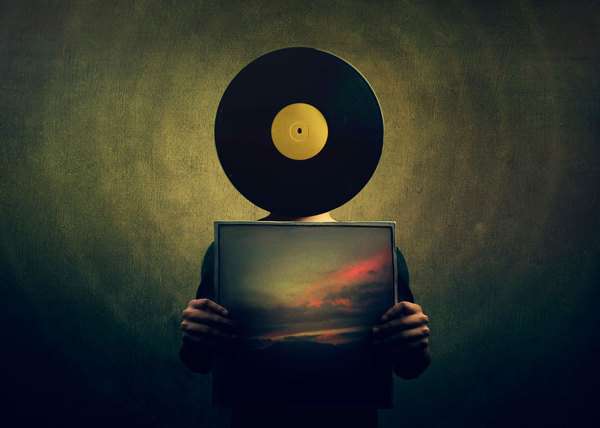 Fig. 29
The public that goes to a photography exhibition or listens to a music piece may also have a similar emotional reaction. Music, as well as photos, share the power to capture determined moments in time; they can both convey memories and experience. Whenever listening to a song or viewing a photograph, people tend to personalise them, thus assimilating art through own perception and lived experience.
In Photography, as it is also the case in Music, it can be safely claimed that there is a universal language with commonly accepted codes: a picture of a person smiling will be most probably perceived the same way regardless the ethnic origin or class of the viewer, despite the possible lack of cultural context. The same applies to music.
If we perceive music as the conscious arrangement of sound and its absence, we may say that photography is the thorough alignment of space and objects – different individually but organic as a whole.
When thinking about notes on a scale or the tones between light and shadow, both photography and music share a common basis. Moreover, they seem to be deeply bound by the concept that Art truly is harmony, both literally and figuratively speaking.
So far, I have been emphasising the connection between photography and music, seeking to demonstrate that understanding both may lead to a further enhancement of our visual capacity.
What is Frequency?
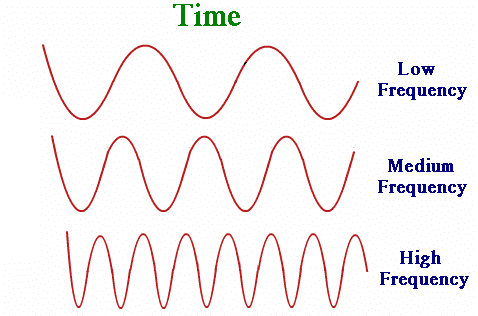 Fig. 30
“Frequency” (fig. 30) is the number of cycles per second (Hertz) (abbreviated as, Hz) of everything that oscillates. The electricity of a wall outlet (AC) is said to have a frequency of 60 Hertz as it cycles negatively than positively 60 times each second.[16]
What is sound?
Sound (fig. 31) is an oscillating wave with a wide range of frequencies. Where a low-frequency sound, for example 50 Hz, sounds like a low rumble, a high-frequency one, for example 15,000 Hz, will most probably sound like a “sizzle”. The average person with no hearing problem can hear up to about 20,000 hz.
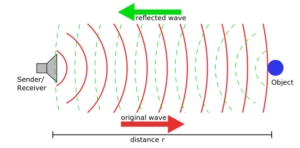 Fig. 31
Sound is like “compression” waves, not like waves of the ocean. When a sound is produced, air is compressed in waves which travel out from the sound source towards all directions. When those compressed air pockets reach the eardrum, that in turn vibrates relative to those compression waves, allowing us to hear. The shorter the wavelength (ie. the distance between each consecutive compression), the higher the frequency of the incoming sound wave. The average sound speed is about 767 miles/hour. Compression waves between 100 hz and 20,000 hz have wavelengths that range between several feet, to a fraction of an inch.
Temperature affects the speed of sound; in a way that’s when temperature is low sound travels also slow. Also sound is affected by the medium it travels through, for example, sound travels faster in water and solids. In water sound travels four point three times faster than in the air, as opposed to solids where it could range from fifteen to thirty-five times faster than in the air.[17]
Speech also has a range of frequencies but limited to 100 hz and 8,000 hz. Remarkably, vowel sounds for example, are in the range of lower frequencies, while consonant sounds appear to be higher frequency sounds.
Interestingly, wired telephones transmit sound up to 3,500 hz which accommodates the 3,000 hz at which the average person can understand speech comfortably.
When people suffer hearing loss, they usually have difficulty hearing some frequencies over others to the extent that it can become harder for them to understand speech. More specifically, people with hearing loss present poorer hearing in high frequencies than in low frequencies. On the other hand, some people may lose lower frequencies, or even middle frequencies but experience less loss in other frequencies. The evolution of hearing aids has now provided the ability to amplify specific frequencies by varying amounts that can be adjusted according to the individual’s needs without affecting frequencies where hearing doesn’t require aid.
My Project
To achieve the final results that can be seen on the separate book with the title “Light and sound by Christos Baimpakis”, I tried different methods and I have done different experiments which we will be demonstrated and explained further throughout this essay.
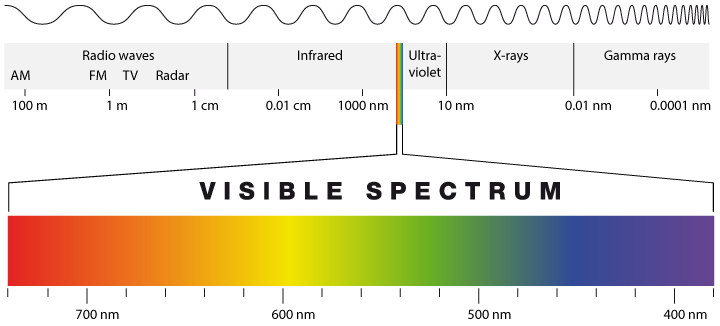 Fig. 32
Halfway through my research and practical experience on this field, I realised that I picked a project with endless possibilities and potential in terms of possible ways the impact of sound can be photographed, but unfortunately I’ve also come to discover I’ve had very limited time in relation to this semester’s requirements. Technically, with the current technology it is impossible to photograph the actual sound since the sound lives in a different spectrum (fig. 32). Therefore, what part-one of this project will try to show is a few examples of the impact of sound on different materials and the representation of it’s image through lasers. Additionally, it will explore what results can be achieved when sound is used to create the composition of a photograph.
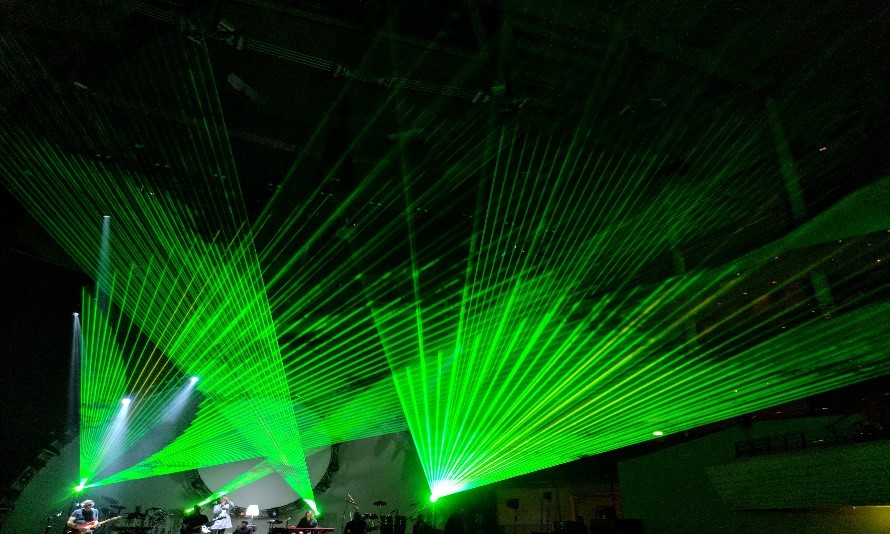 Fig. 33
The idea of this project started when my tutor asked me, if I believe there is any way that sound can be photographed, as he knows that I am interested in music.
As soon as I started my research it became evident that not many people had tried anything similar before. Consequently, my initial instinct was that something like that would be almost impossible for me given I had very limited resources. So I put it to one side trying to explore and carry on with some alternative ideas that seemed to be easier.
After discussing my ideas with my tutor, we decided that it would be beneficial to stick with my main idea which was to photograph anything related to movies. Cinematography and films is another field that I am very interested in and is also one of the main reasons I am studying photography today. I thought maybe the project could be on stills from movies or anything related to cinematography. So I started looking into Gregory Crewdson’s work (fig. 34) who is a photographer that I admire and whose work is really close to what I’d like to do
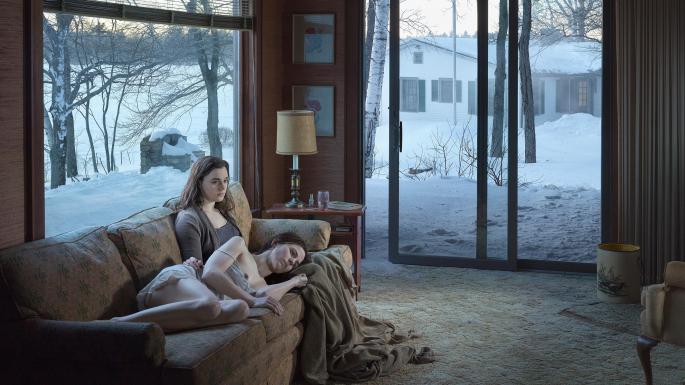 Fig. 34
Through my research though and after a few meetings with my tutor I discovered Hiroshi Sugimoto and his project “Theatres”. I tried to take a similar photo like Hiroshi’s (fig. 35-38) and also I experimented with other photos related to music halls (fig. 39-41) but it was not what I was looking for.
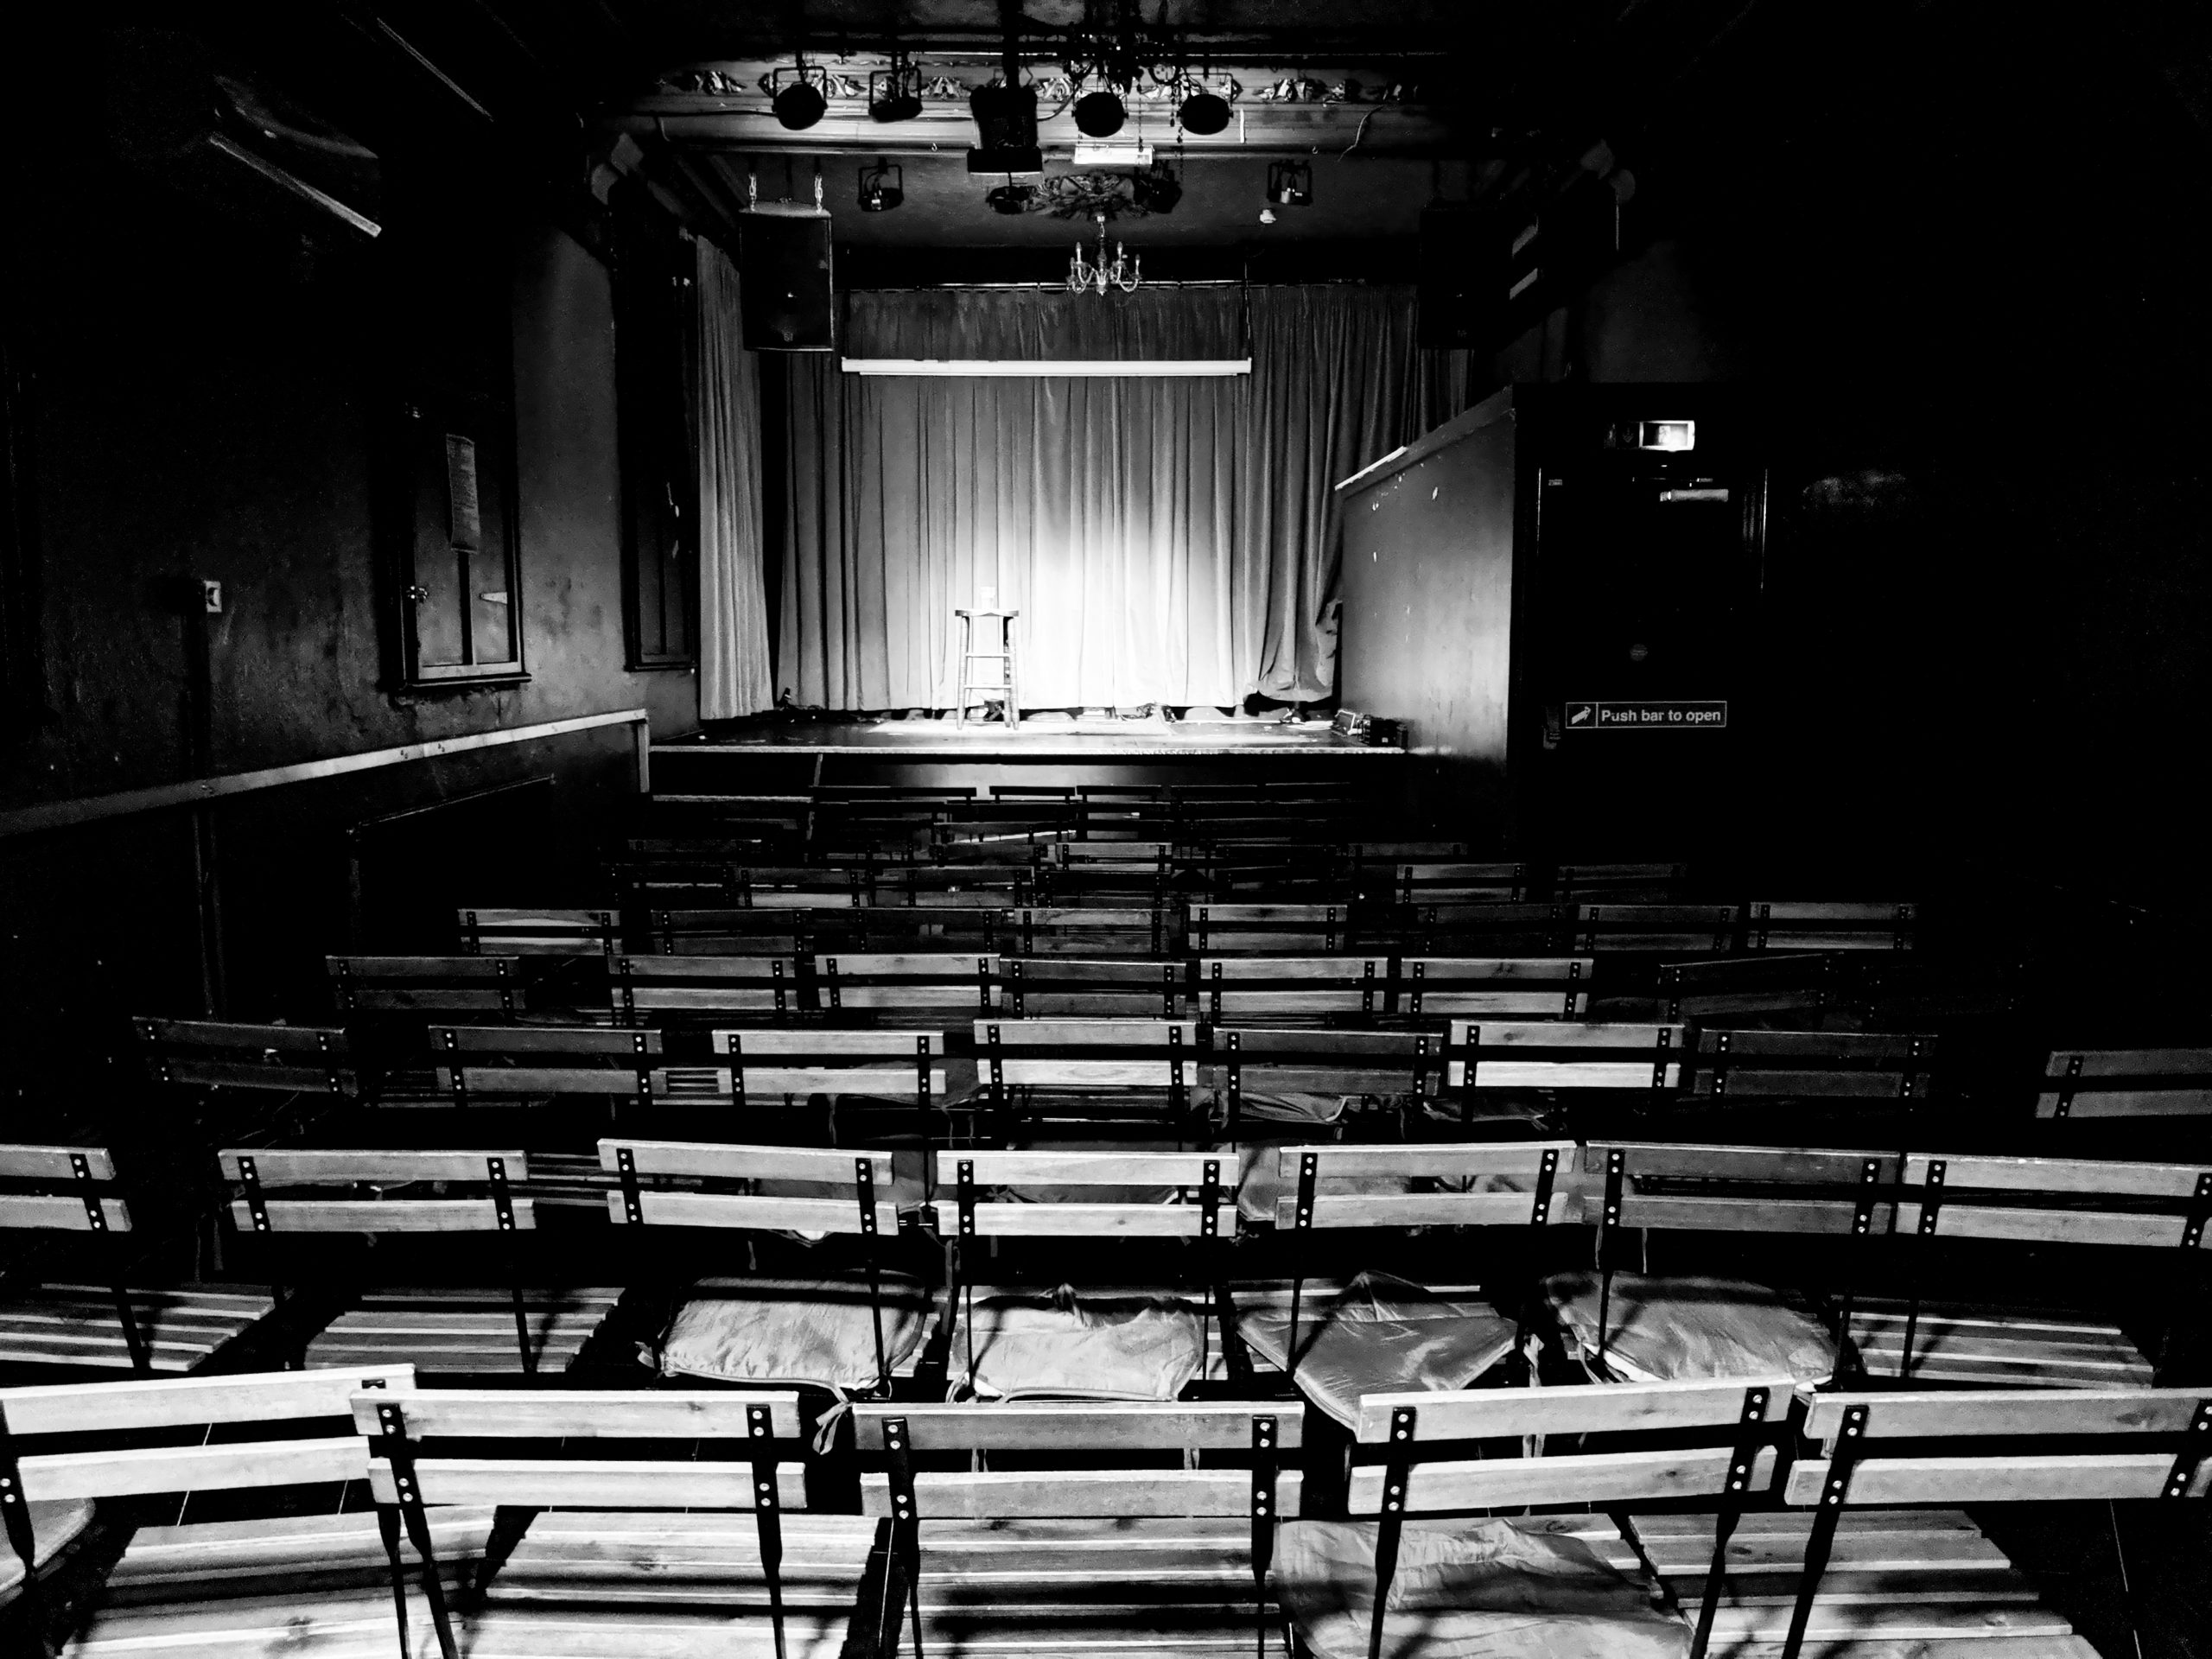 Fig. 35
 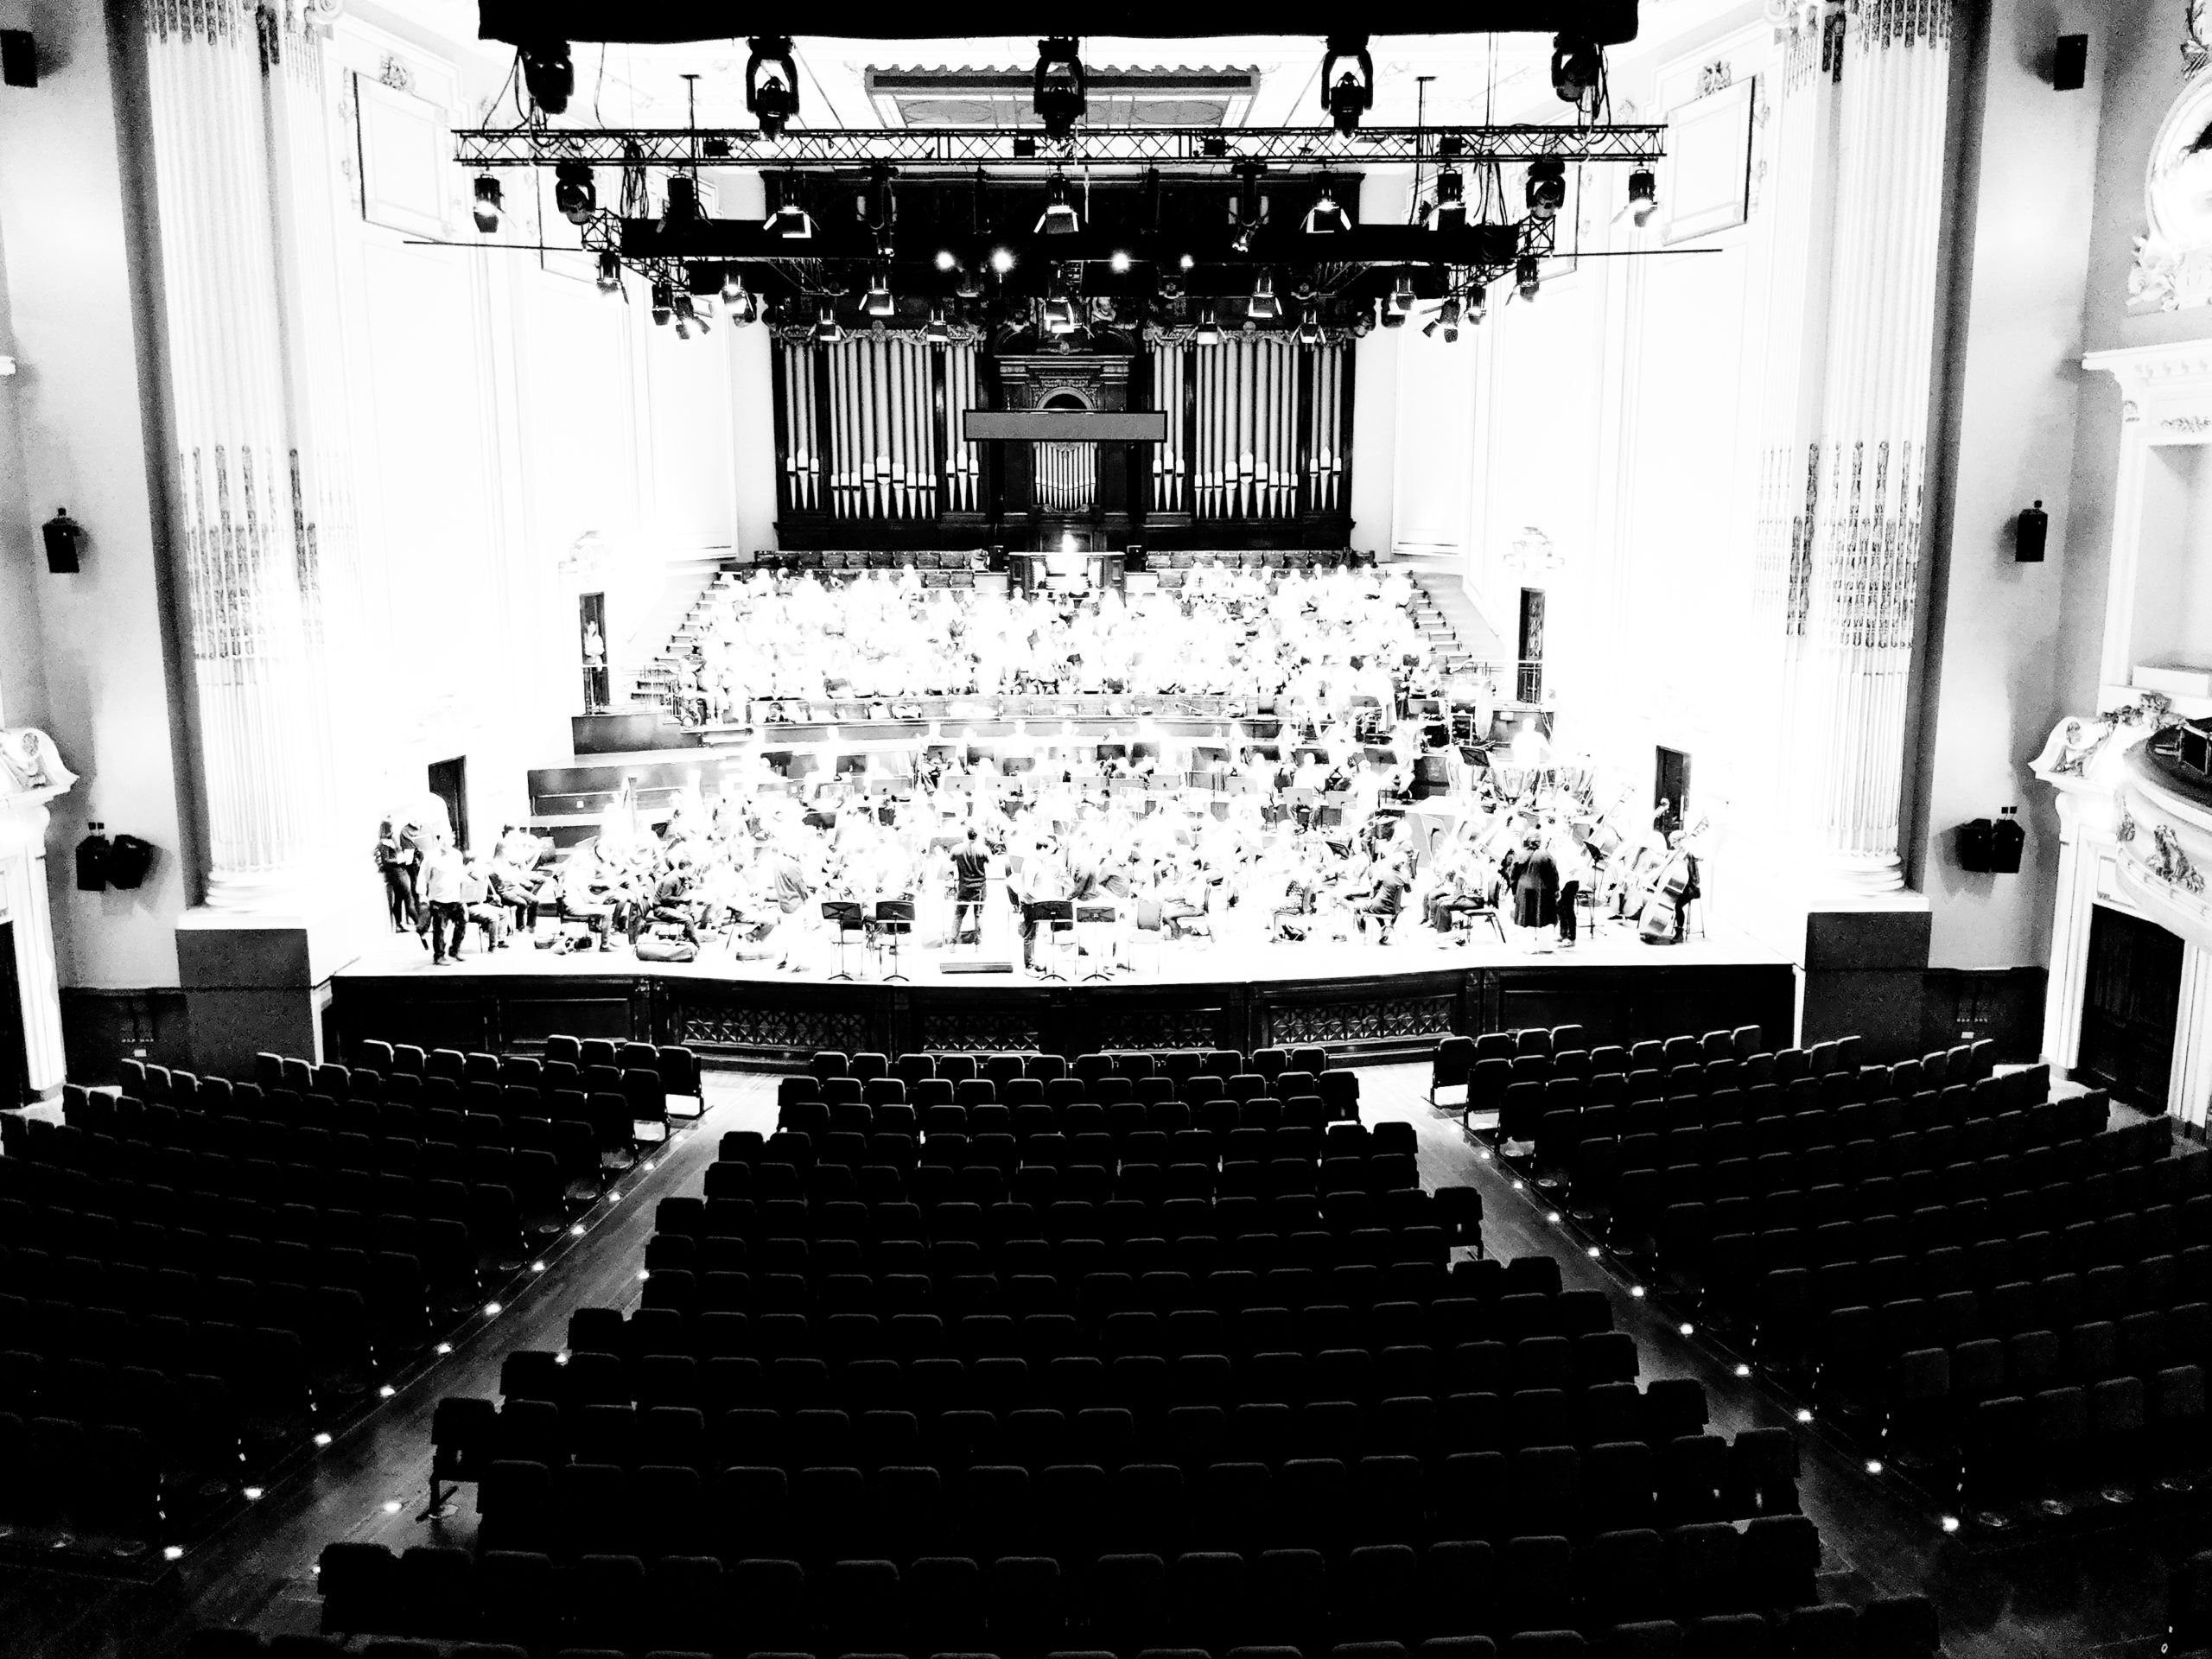 Fig. 36
 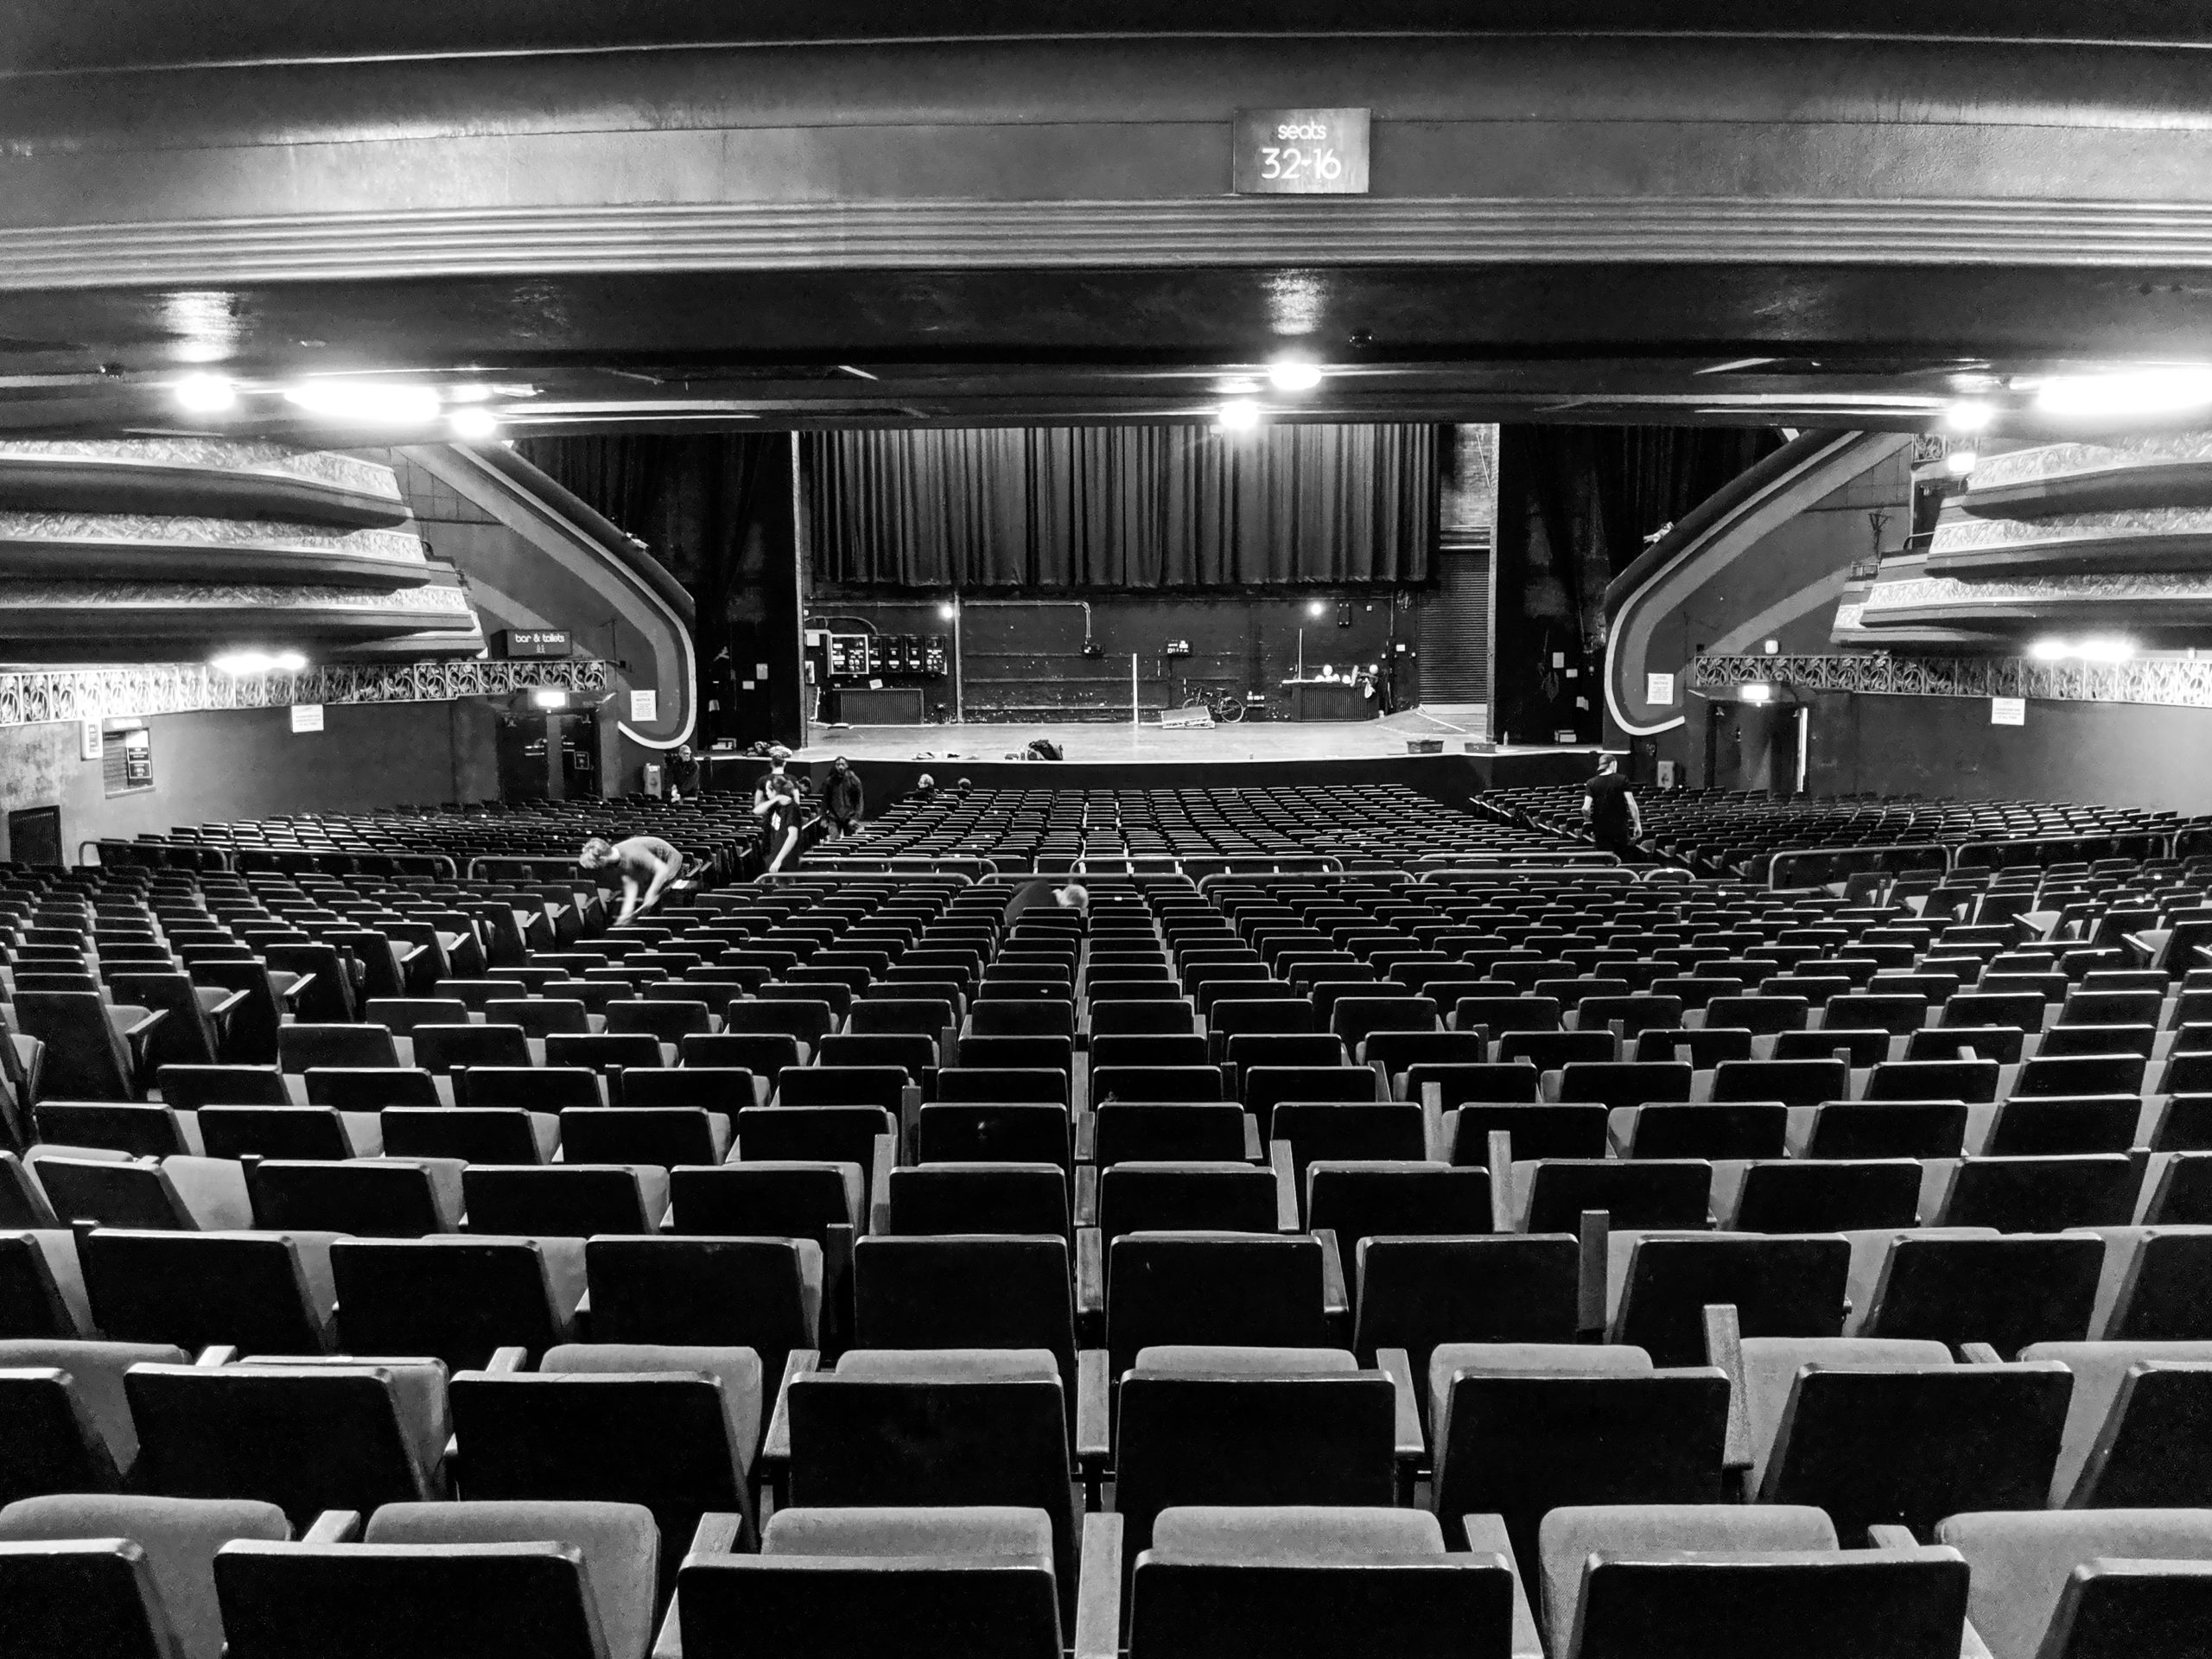 Fig. 37
 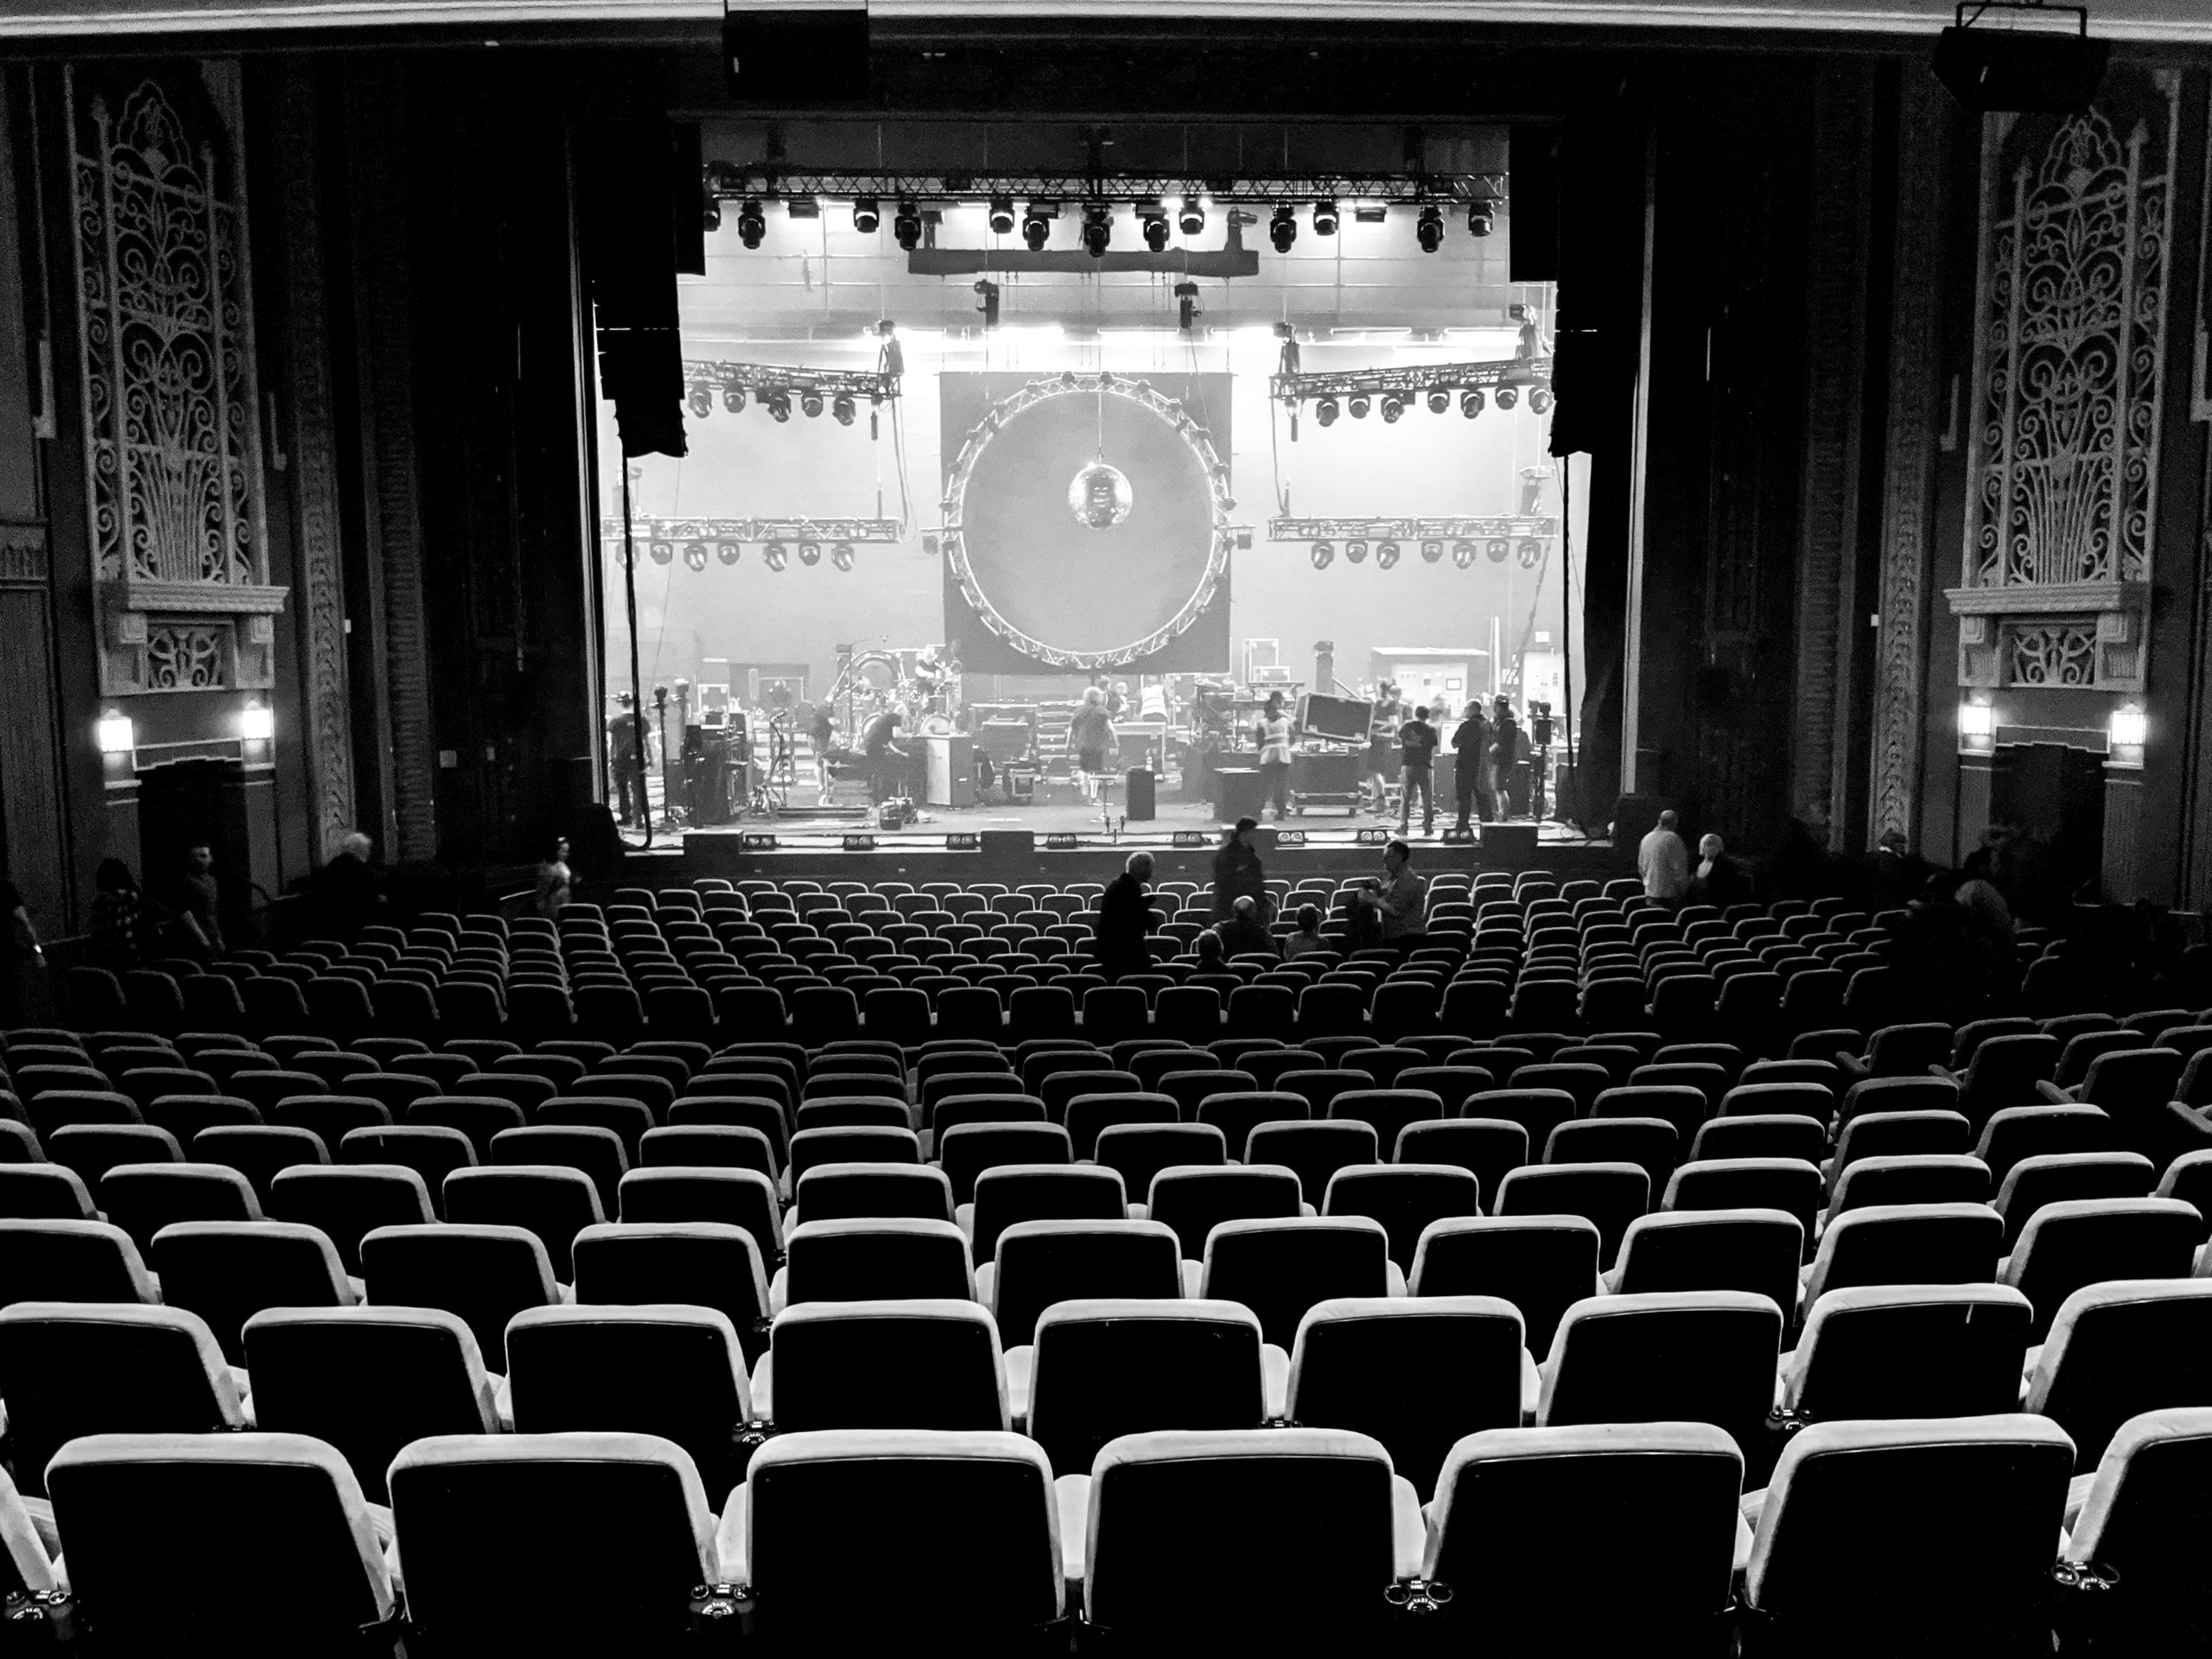 Fig. 38
  Fig. 39
 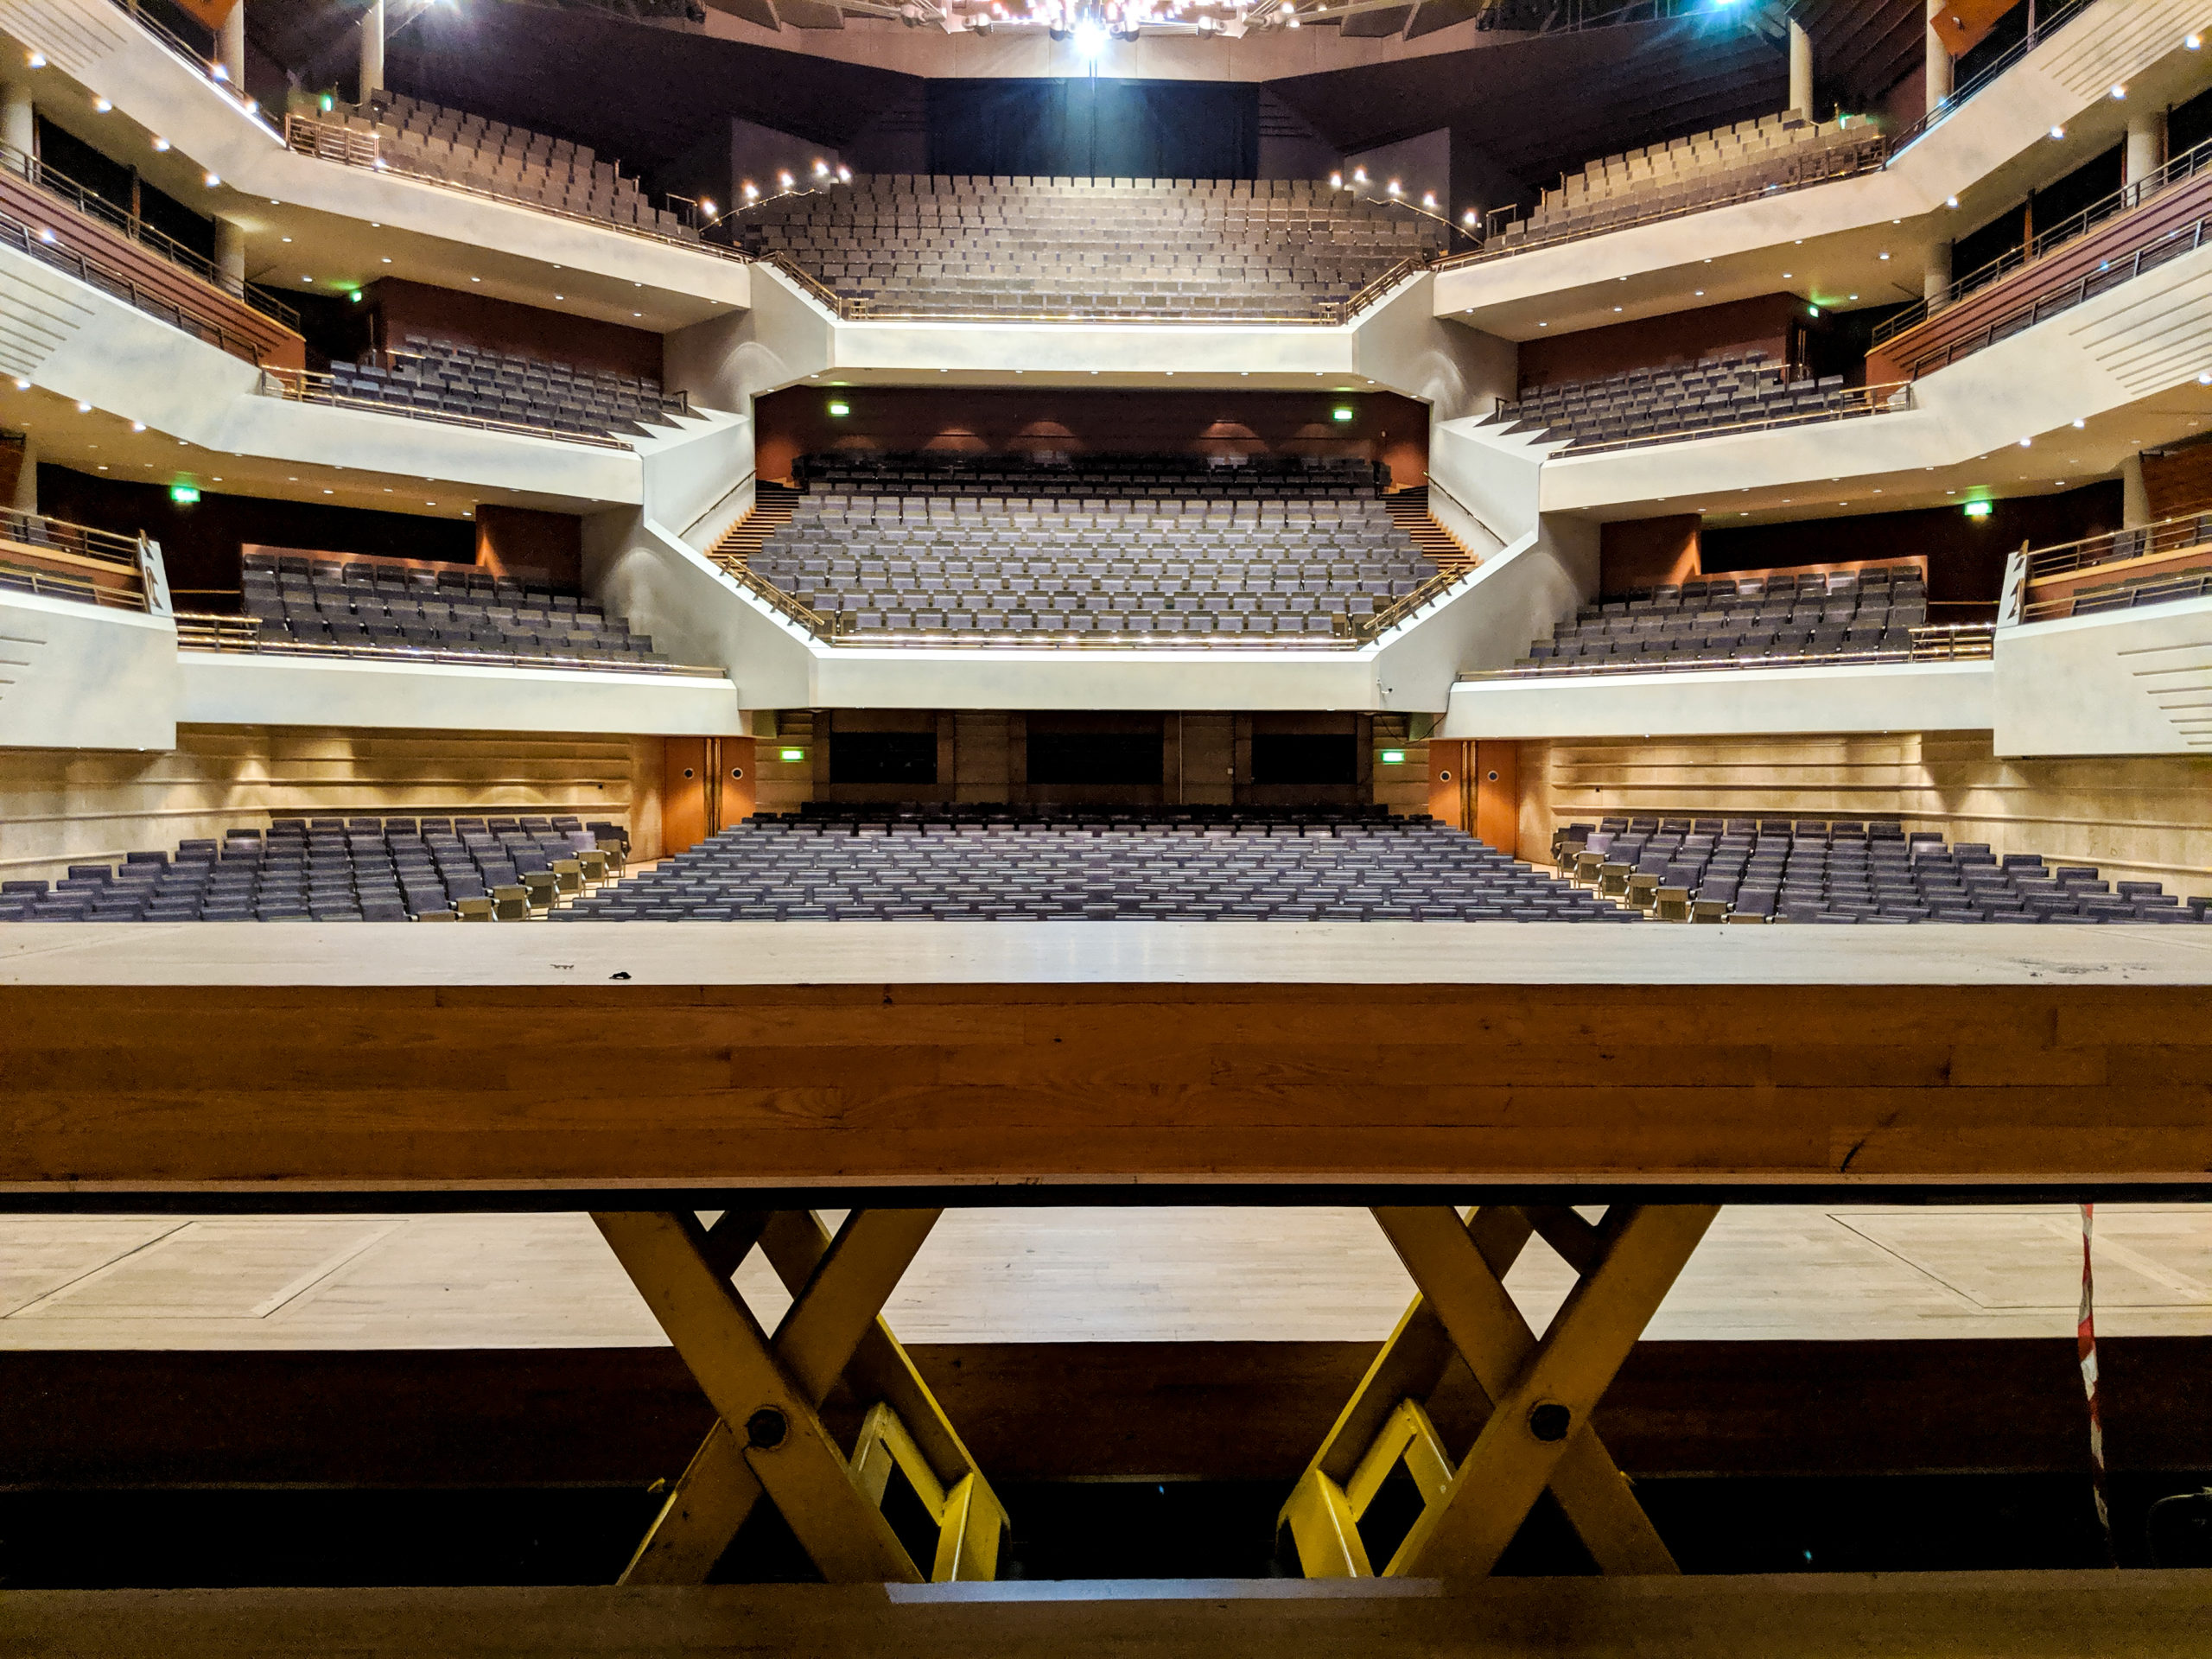 Fig. 40
 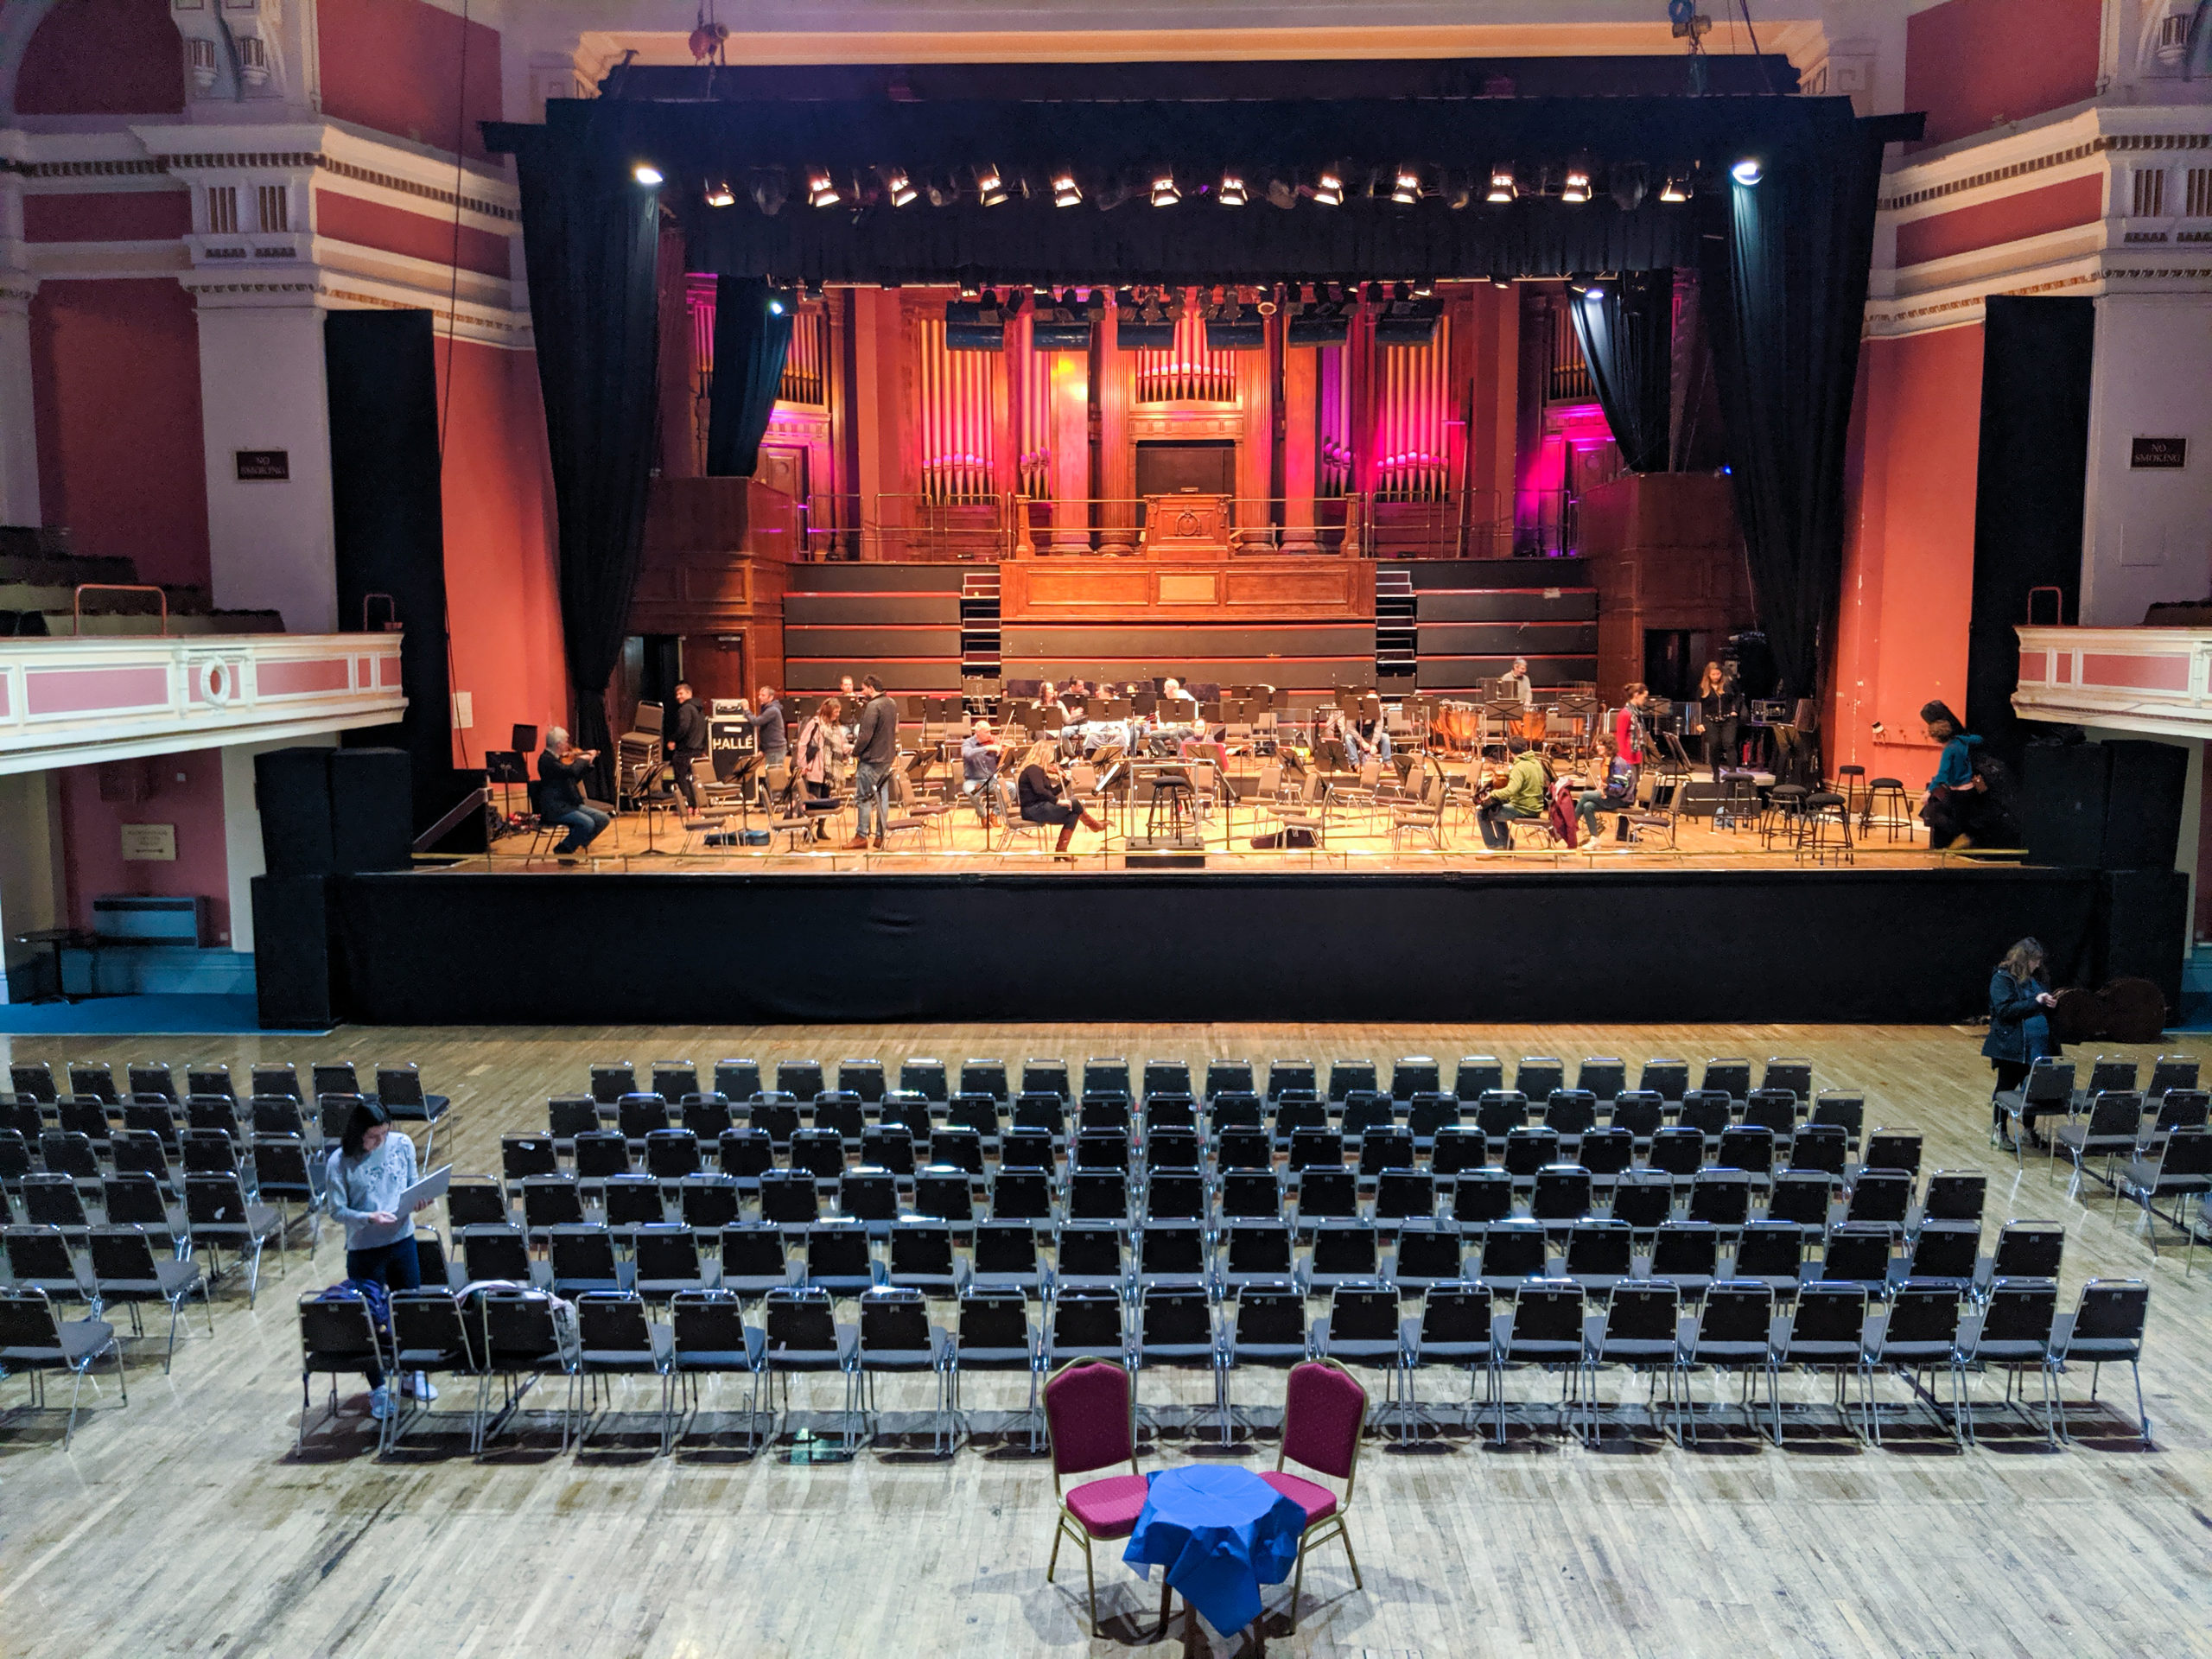 Fig. 41
This project though, because of Hiroshi’s approach, made me think how we can see the invisible. Even more remarkable was how to find it, see it and then how we can capture it so other people can see it as well.
That triggered the original idea I had, relating to sound. Every day, gradually every bit of information that I had gained from my influences started to emerge again and even though I was working on gathering information on the cinematography project, the idea about sound was slowly growing and becoming more intense as I have always been fascinated by audio-visual technologies.
My approach to the sound project had to change dramatically. I started looking into music bands and what technology is applied to create the effects they use on their shows. Many bands use stage lighting, smoke machines and laser in combination with sound to create that visual scenery which invites viewers to use all their senses for a better experience. One of the best examples is the British rock band, Pink Floyd.
 Fig. 42
In the process of gathering data for my research, I came across another great artist from Iceland, none other than Bjork.
I did not know much about Bjork, but I discovered that the Icelandic artist did a project with the name Biophilia with its debut being in Manchester. That was the project that made me look into the impact of the sound from a different perspective. It took me considerable time to discover what equipment she uses and how she produces such fantastic results. I was fascinated by her idea of combining art and science.After days of research and believing I had found what some of the equipment she used was, I started trying to see if I could source it. I contacted some people and some companies whom I was hoping that may be able to help but unfortunately, and as expected to a degree, such equipment was beyond something that I can afford right now. It is nevertheless, something I will definitely look into further or even replicate, by any means possible hopefully in the near future, as it is something that I’m really intrigued to experiment with.
The next step was to use at least the same approach Bjork did and use a different medium to capture what I wanted. That’s where Pink Floyd offered the inspiration which prompted me to start experimenting with laser lights. The problem I was faced with then was that I did not know what other equipment to use to capture the vibrations of the sound.
It took a lot of research until I finally came across a video on YouTube where somebody’s DIY project gave me hope I could finally recreate something very similar.
I used a small Bluetooth speaker and I placed it into a container (fig.43). Then I stretched a balloon on the top of the container (fig. 44) covered it and glued a small broken mirror in the middle of the container on the balloon (fig. 45). Then I pointed a laser to the broken mirror (fig.46) so it can reflect the light to the wall (fig. 47). Also, the laser was attached on to a hand helper for soldering work and on the tripod to stabilise it (fig. 48). This way, I would be able to capture the movement of the balloon. Later on, I started passing some music to the speaker using my phone, which was connected through Bluetooth.
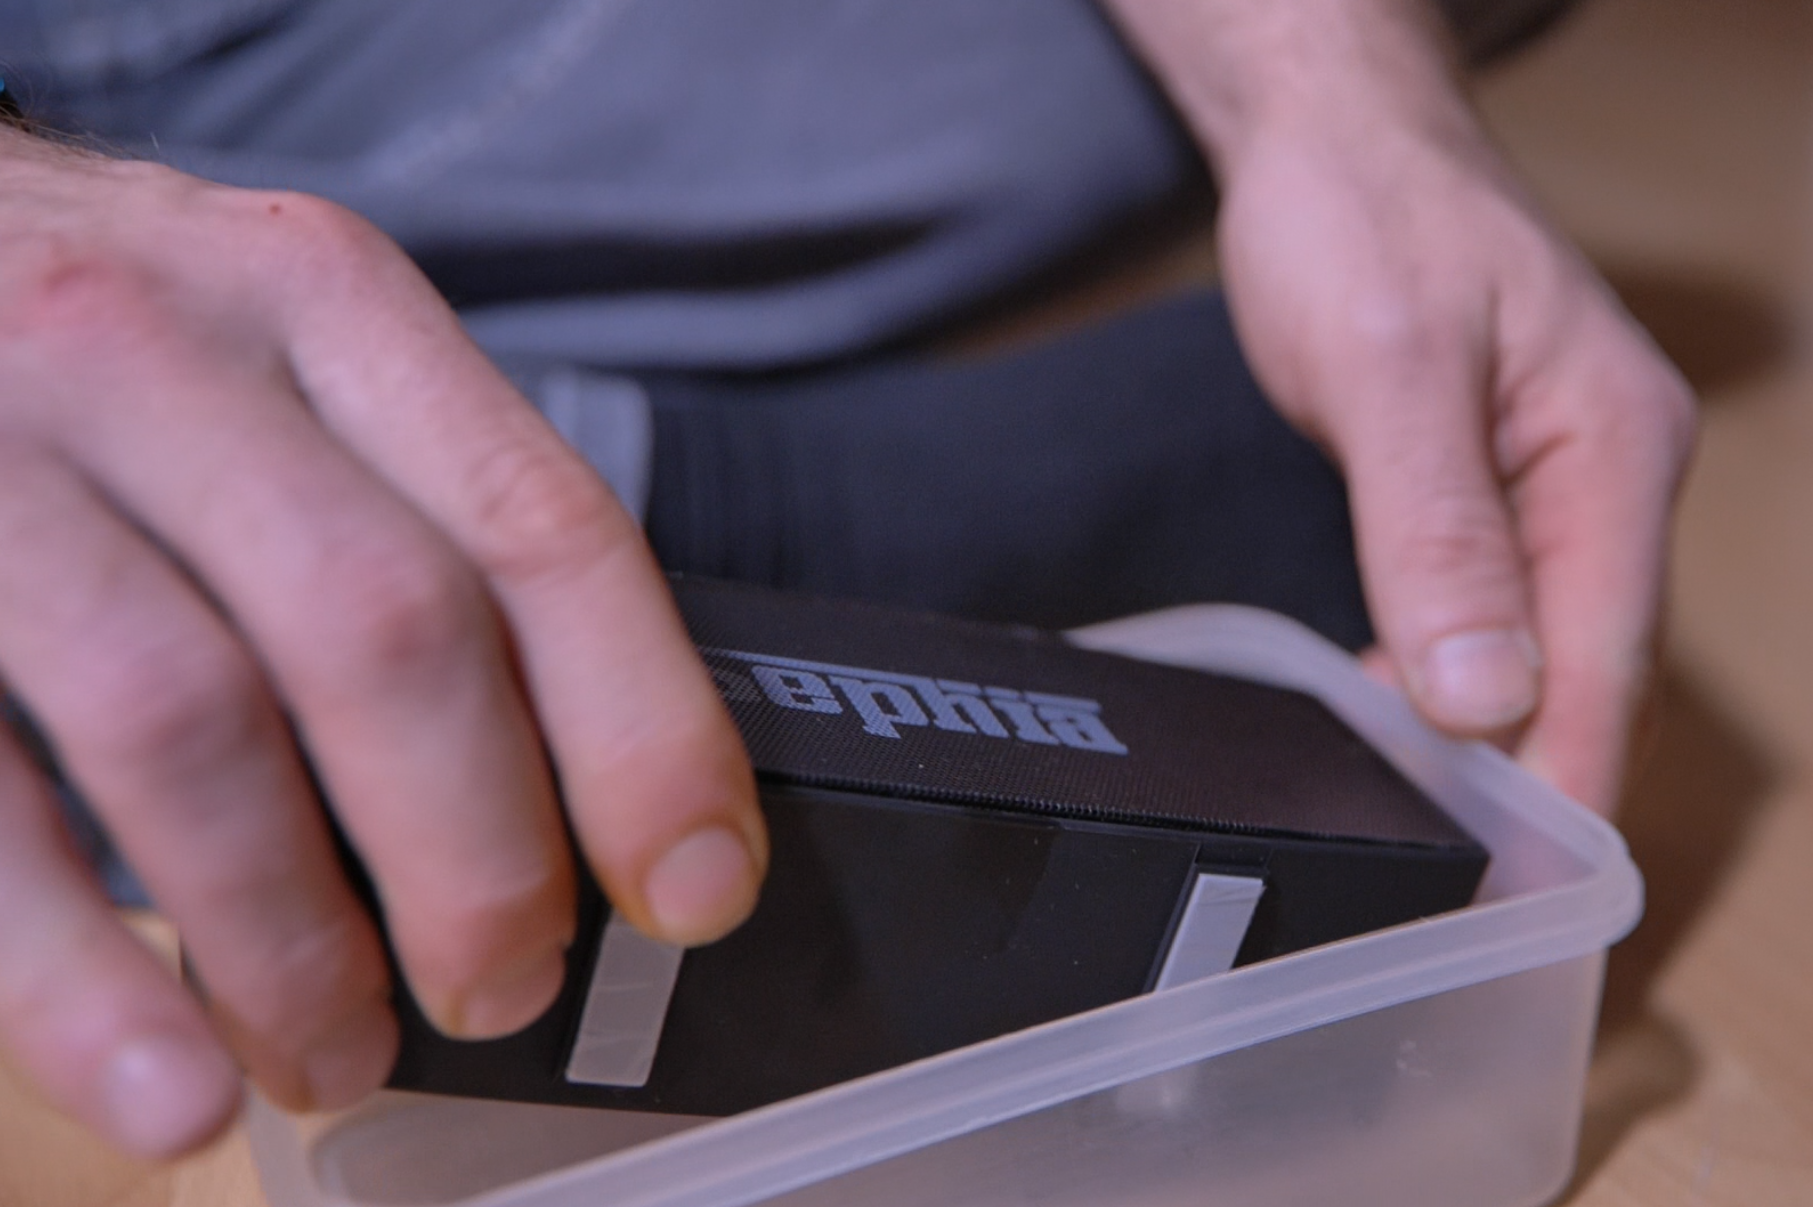 Fig. 43
  Fig. 44
 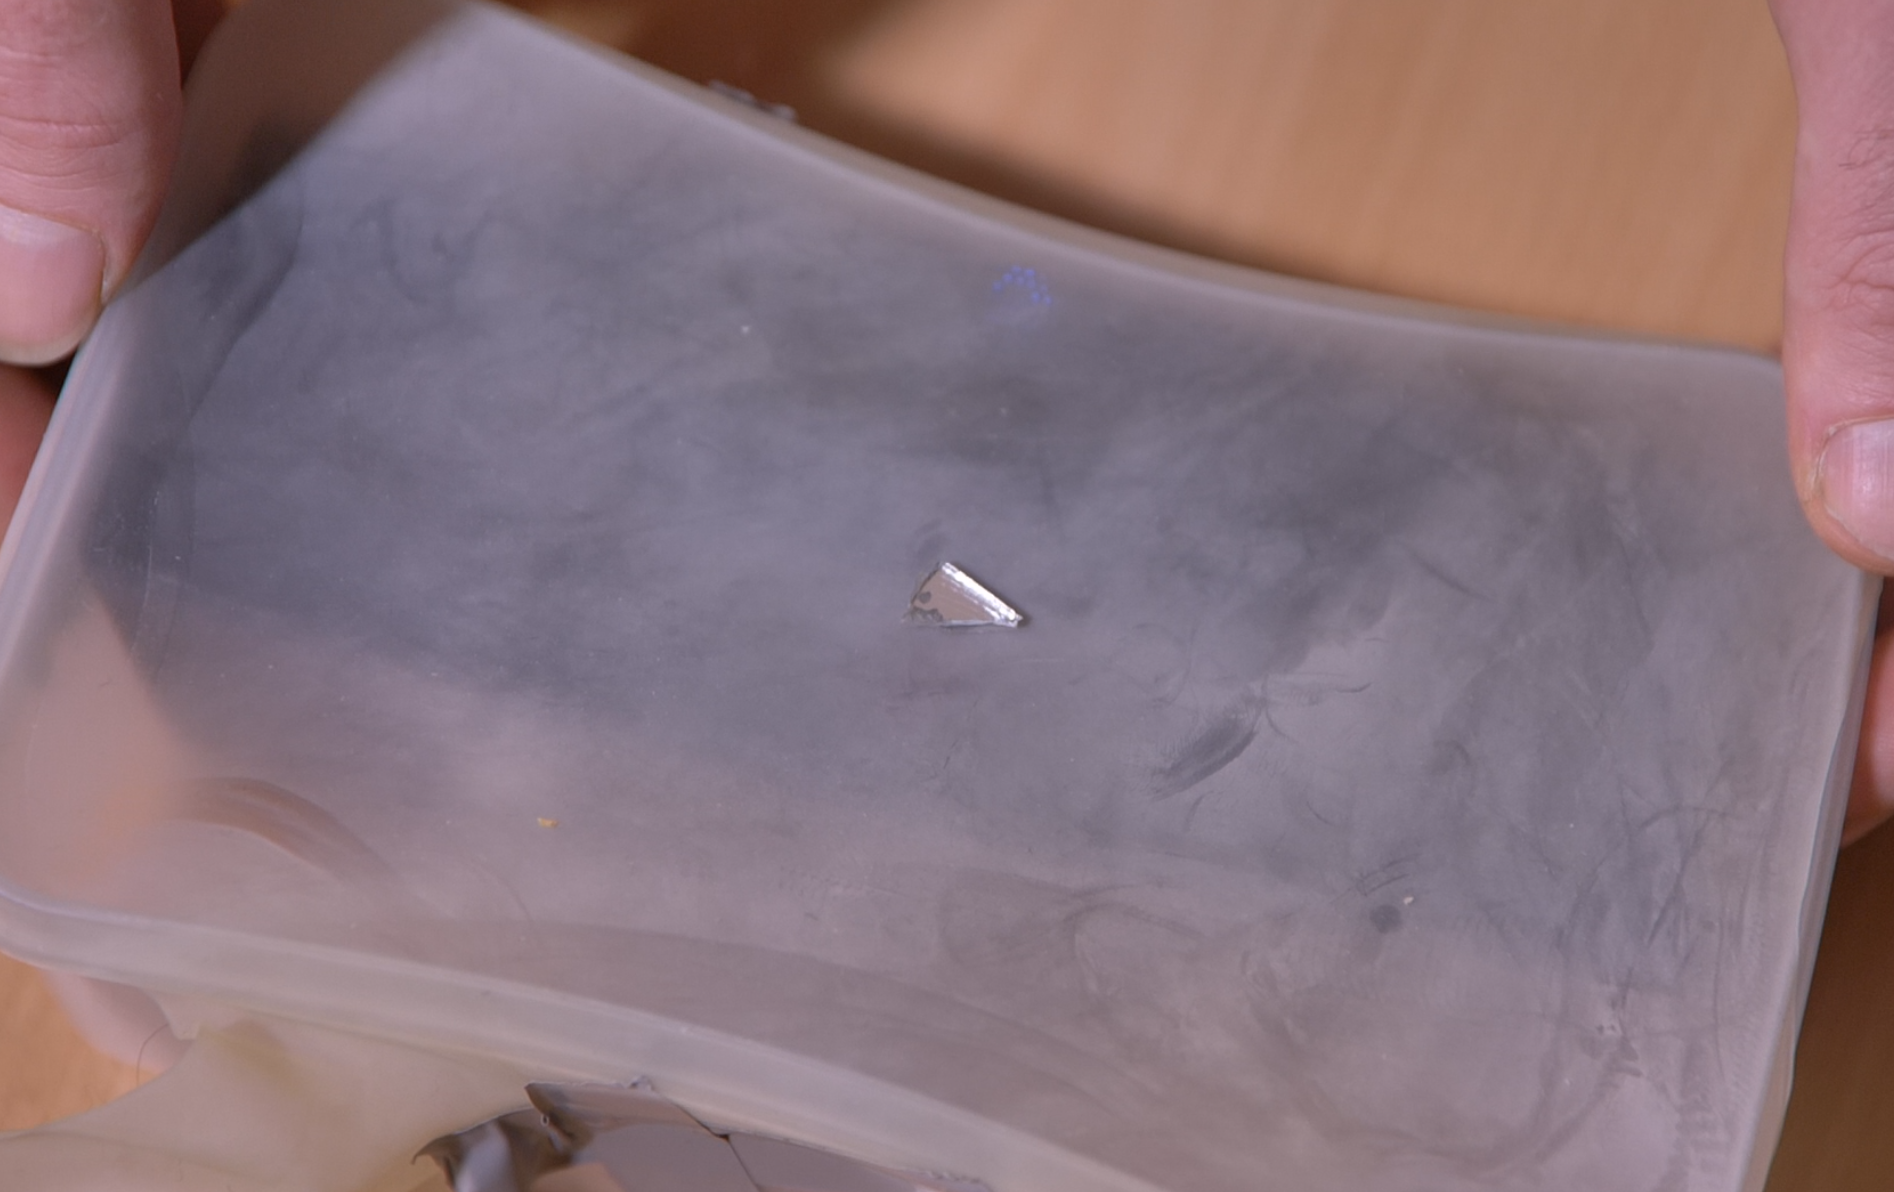 Fig. 45
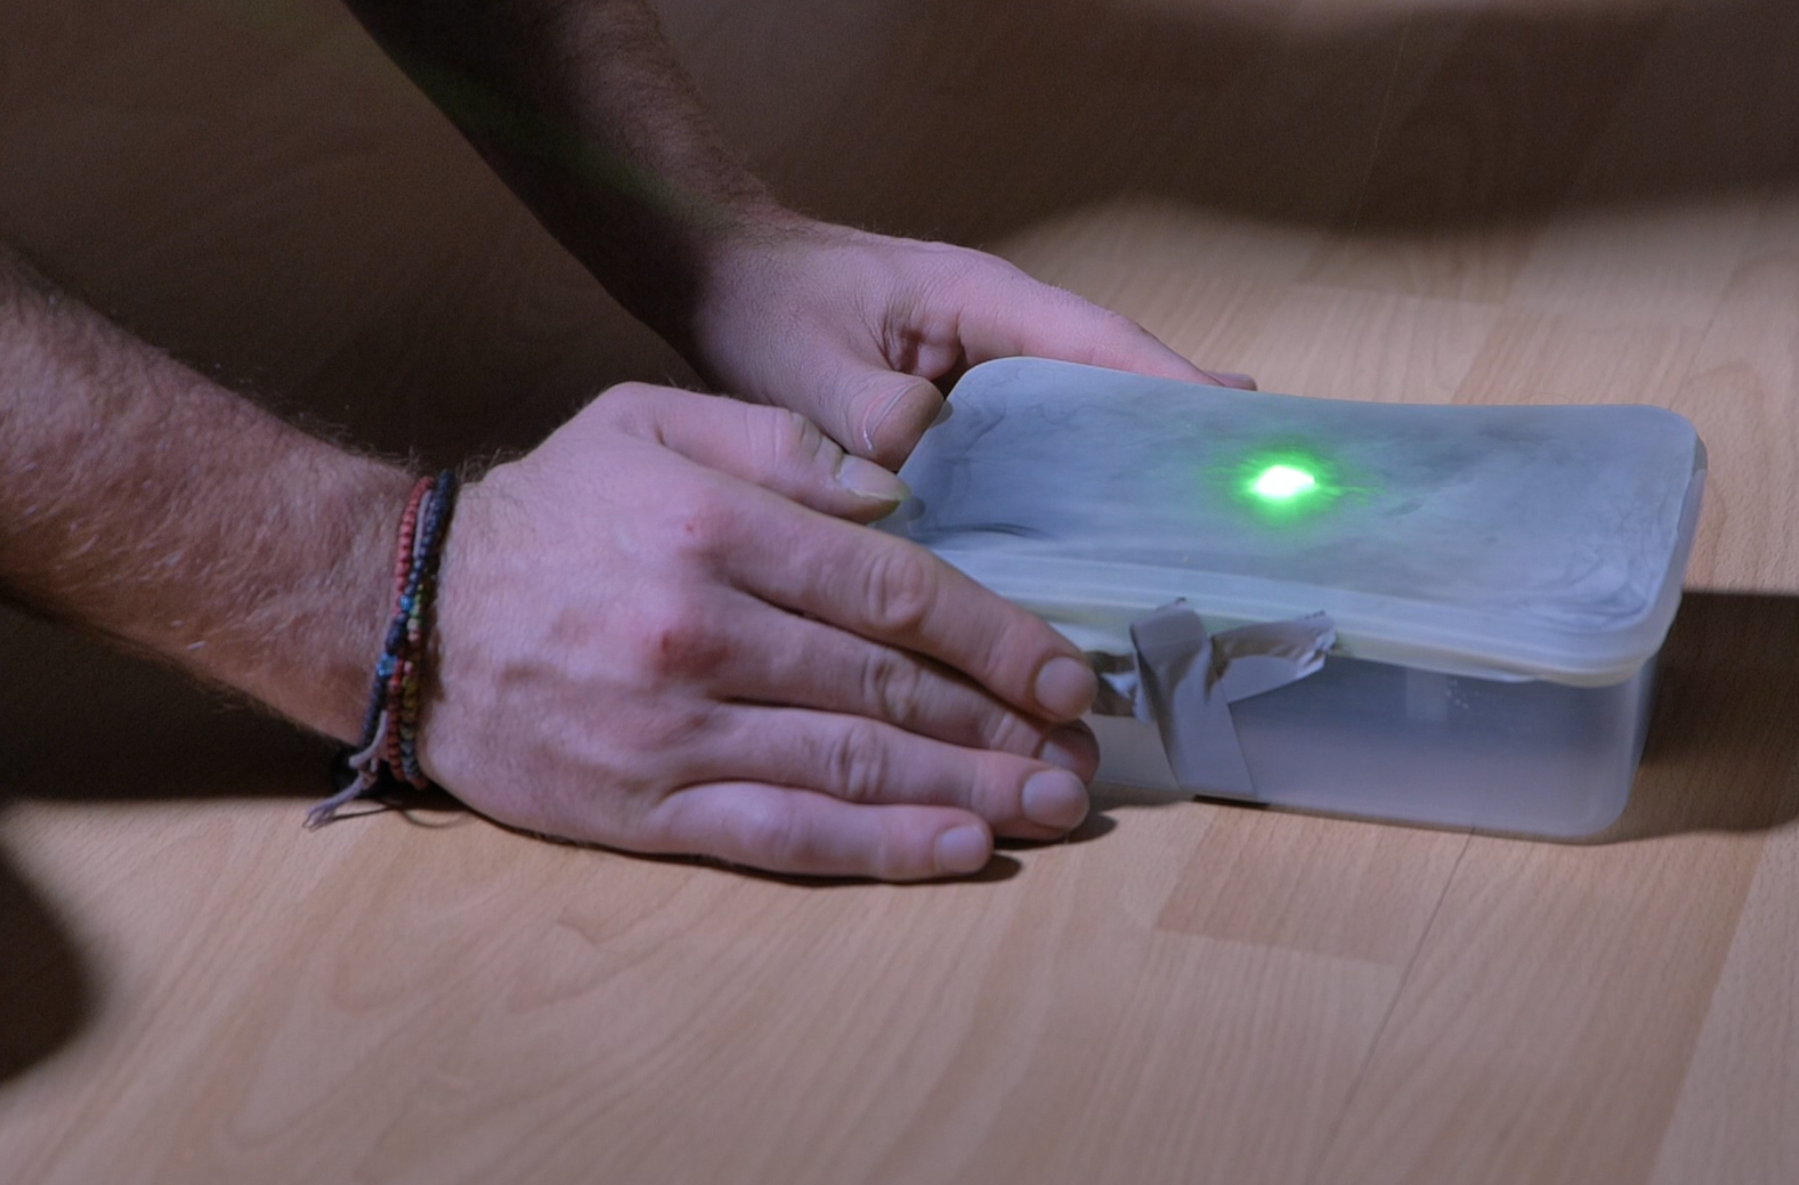
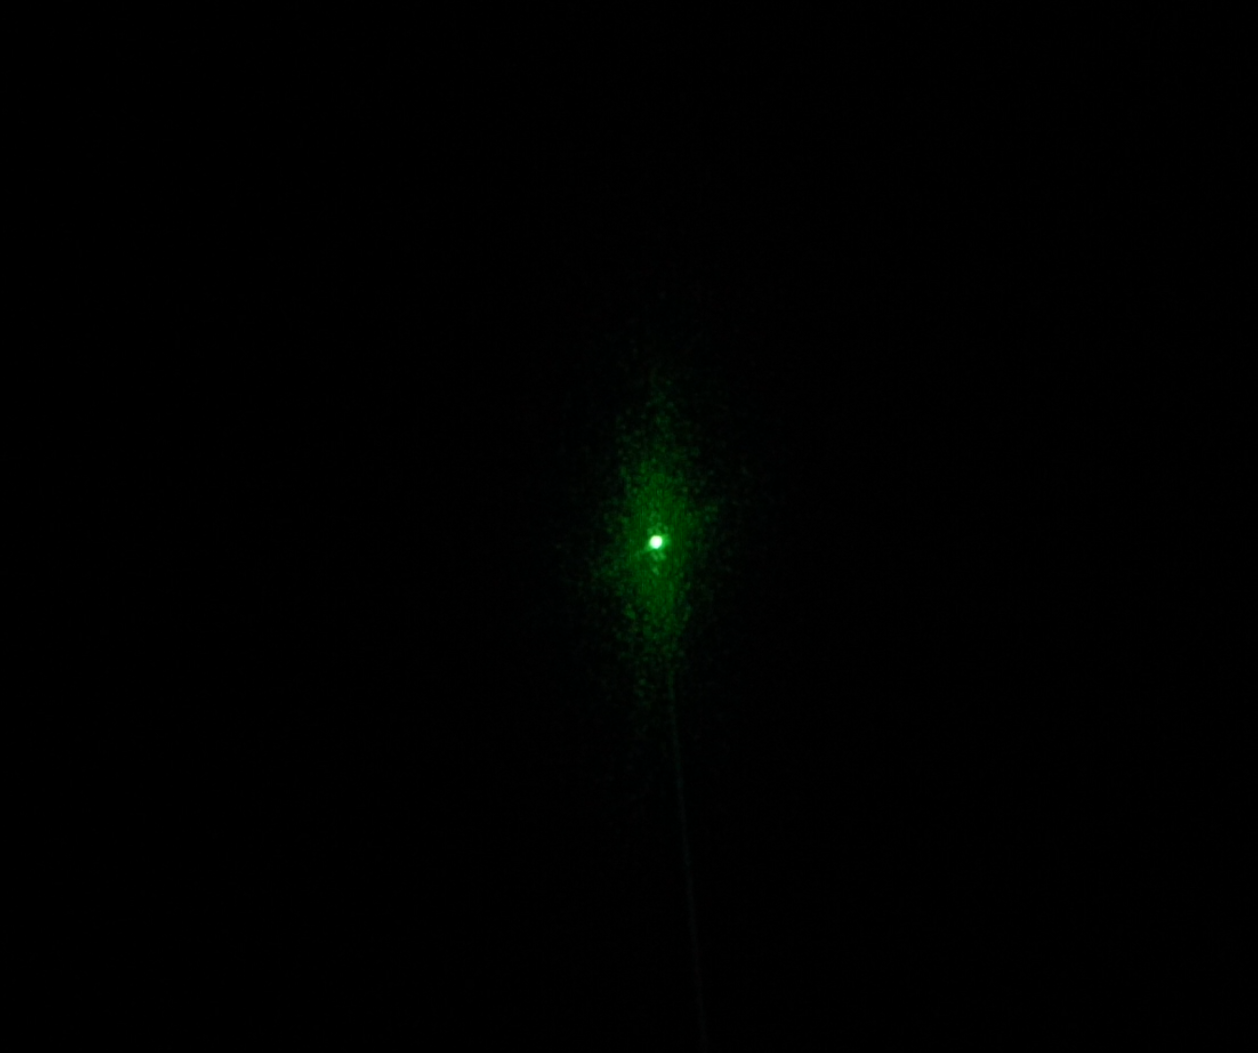 Fig. 47
 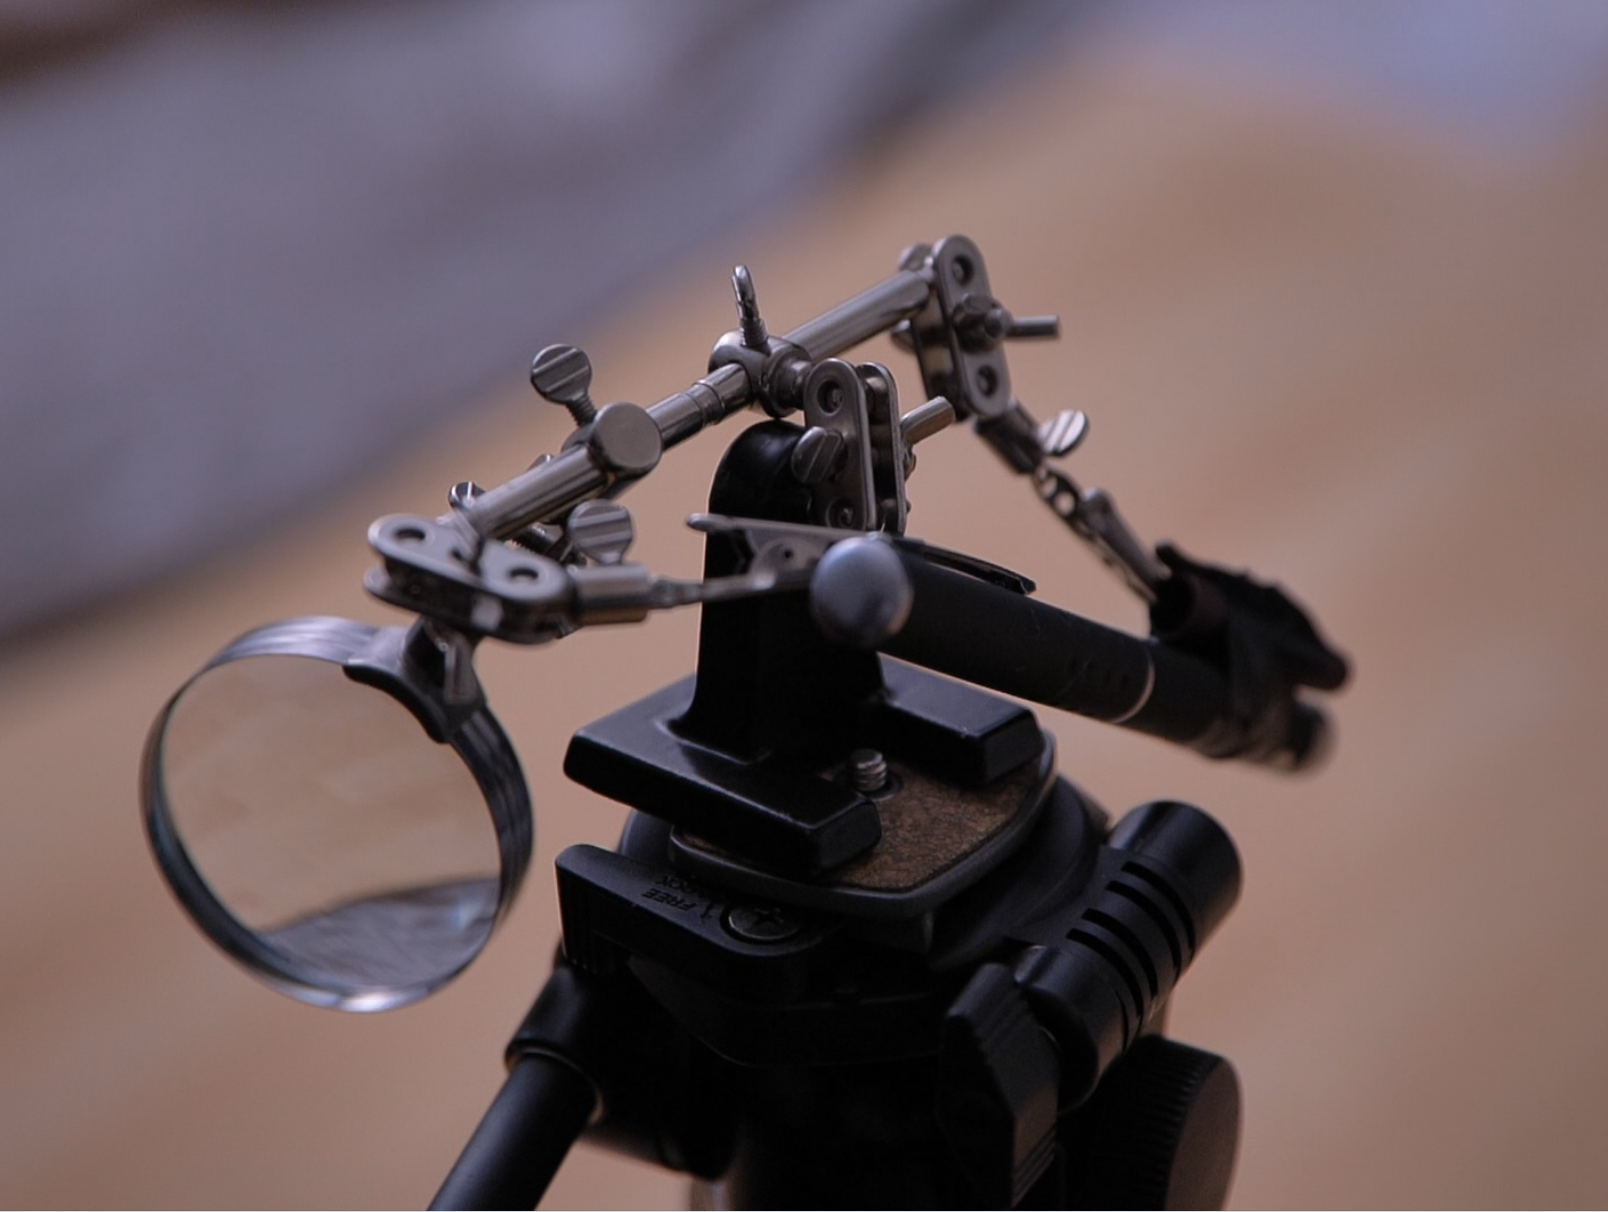 Fig. 48
Surprisingly enough, I saw the laser changing shapes on the wall, but the picture was not very tidy (fig. 49).
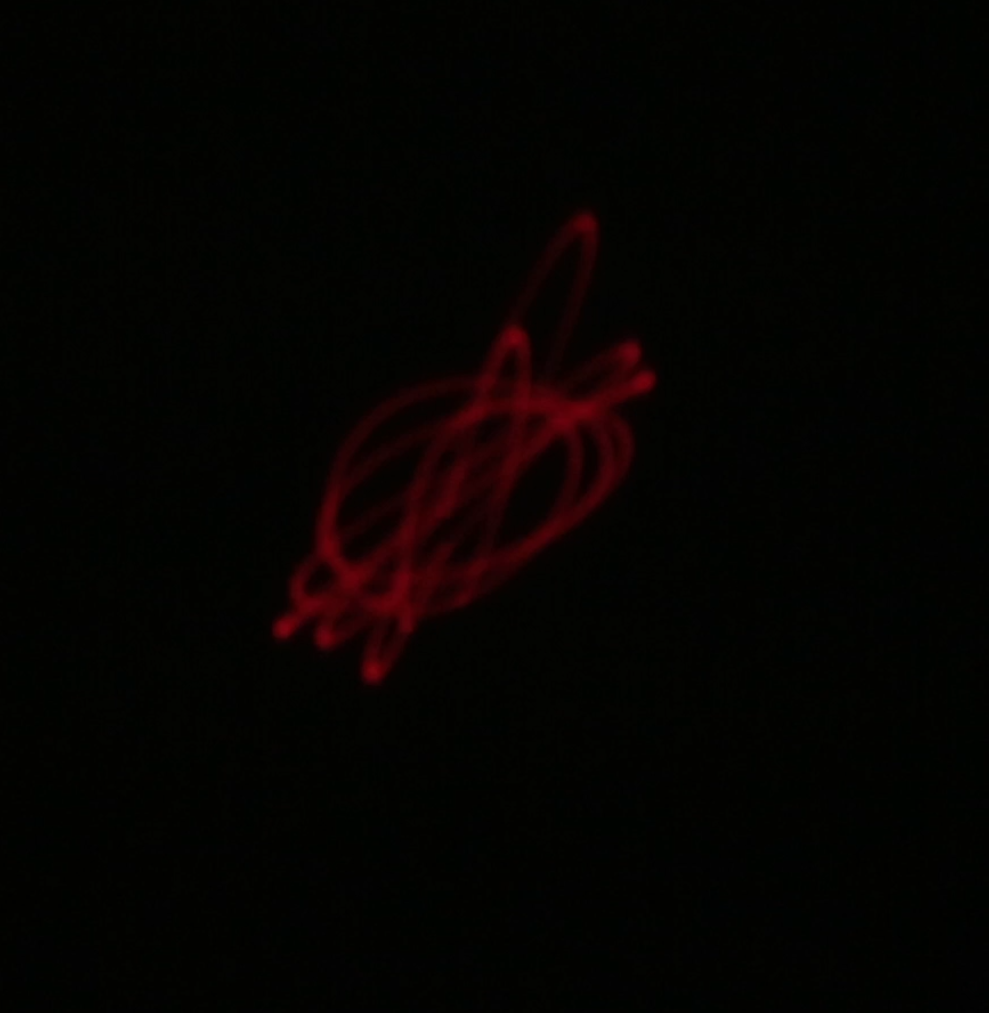 Fig. 49
I wondered if that was due to maybe too many instruments playing at the same time and the signal not being straight forward, in order for the vibrations on the driver of the speaker to move harmonically.I decided to pass a few single frequencies through an online tone generator which was connected to the small speaker to see what would happen. Suddenly the laser was creating perfect shapes and was looking very clean and tidy (fig. 50).
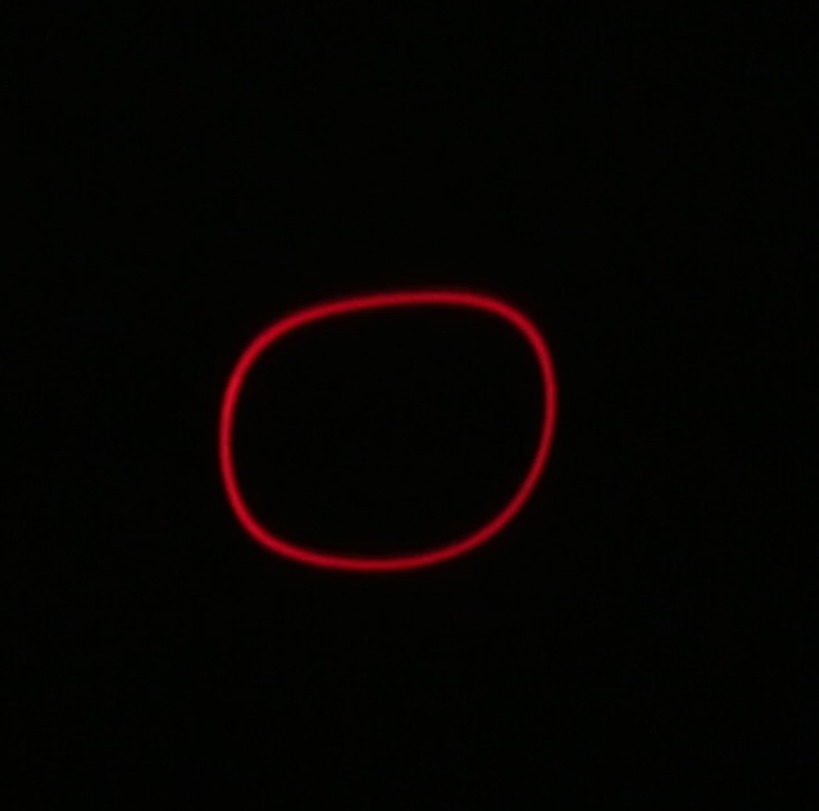 Fig. 50
Then I was curious to see what would happen if I passed two frequencies through the same speaker.
That was the magical moment some acceptable results started to appear before my eyes. The laser started to move in a harmonic circular movement and some more propositional perfect shapes were coming from inside the first shape (fig. 51).
The next steps were to buy more prominent speakers to be able to create cleaner results. Through the practical experience, I came to notice that the bigger the speaker the more vibrations it generates, especially when low frequencies played. For that reason the speakers’ dimensions that I bought are 10 inches, 12 inches and 15 inches. Additionally, they are not full-range speakers but subwoofers which means they pick more of the low frequencies. Low frequencies create more interesting fuller visual shapes.
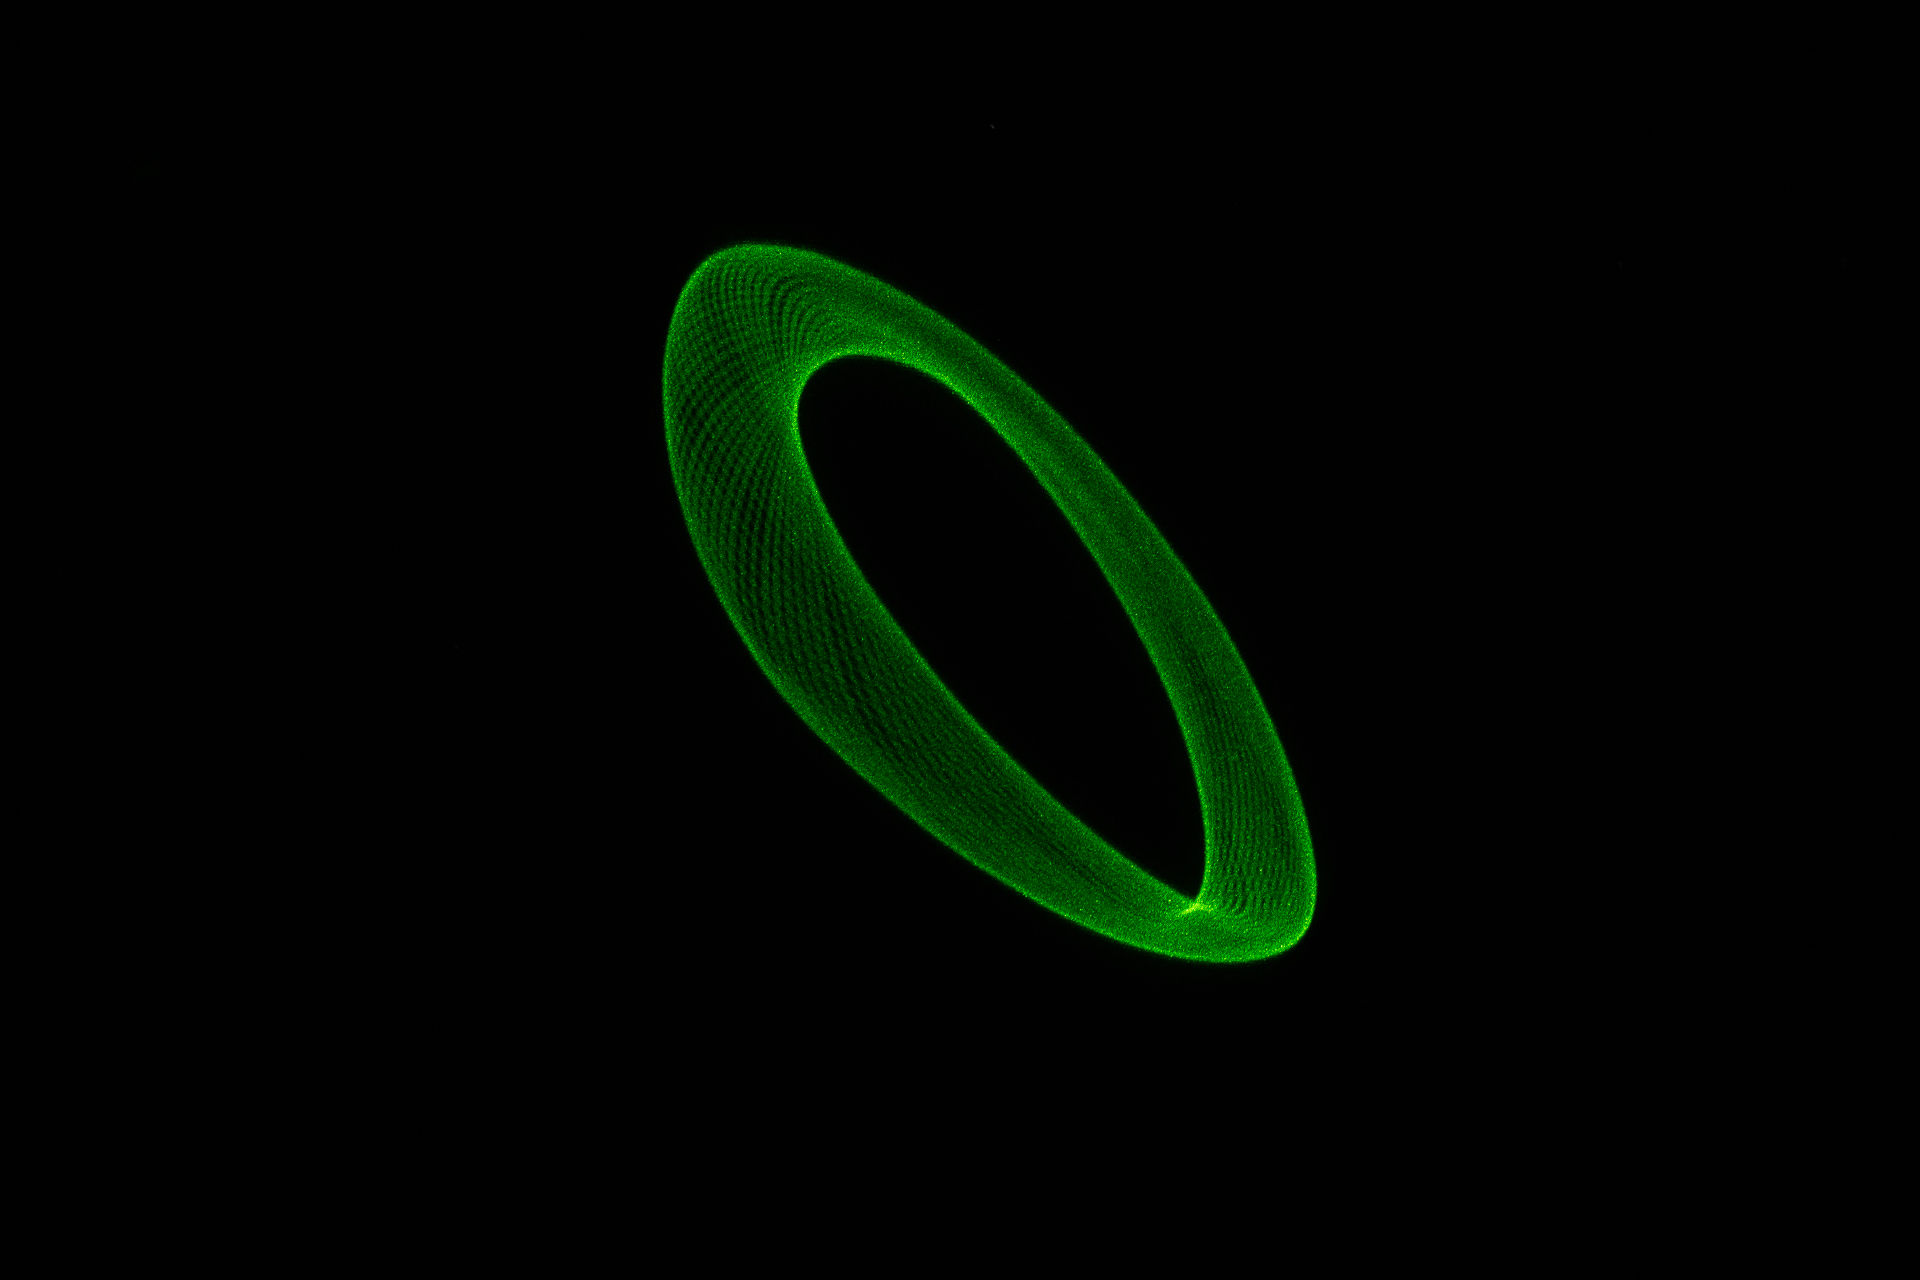 Fig. 51
I was really impressed with the results and the most prominent research ever started as I really wanted to know what would happen if I sent to the speaker some chords used in music to compose songs.
I tried every possible combination that I could think of, such as Perfect fifths (fig. 52, 53), minor thirds (fig. 54, 55), major thirds (fig. 56, 57), octaves (fig. 58), scales and also randomly picking notes (fig. 59, 60).
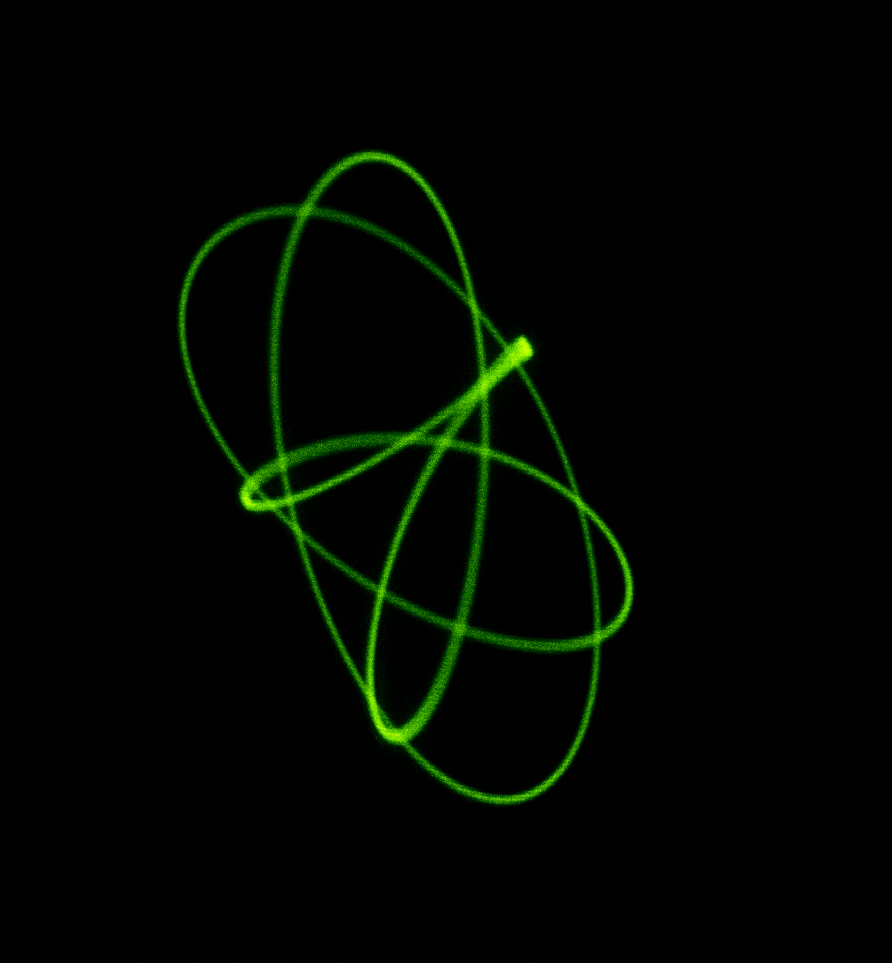 Fig. 52
 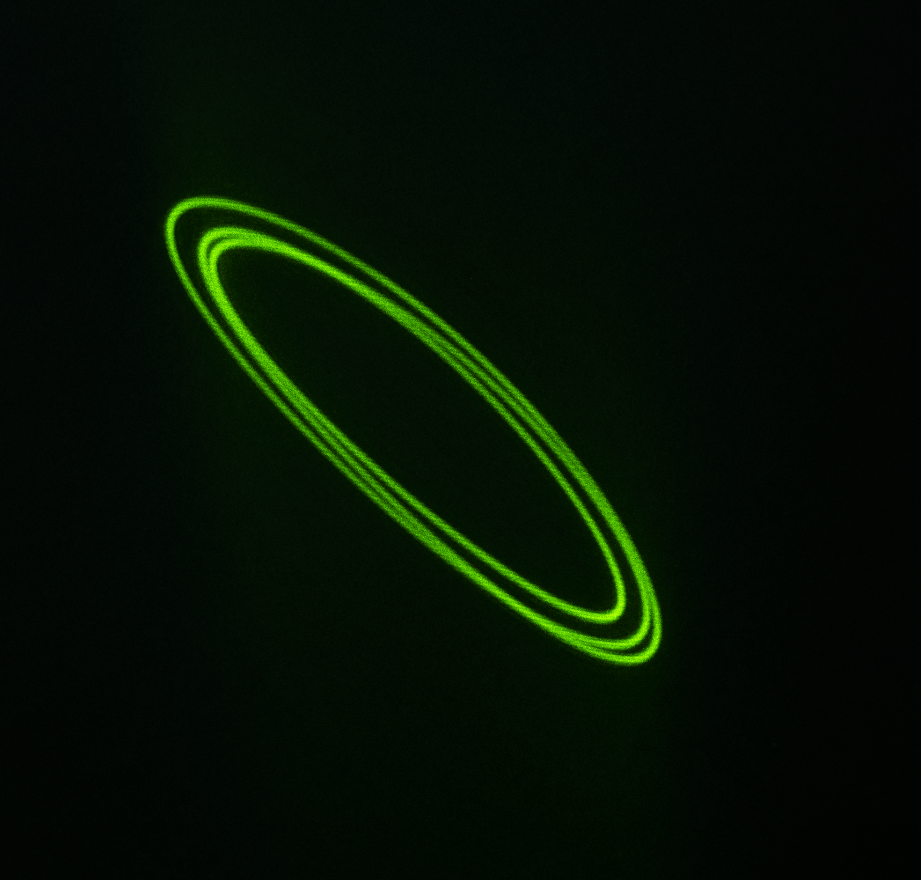 Fig. 53
 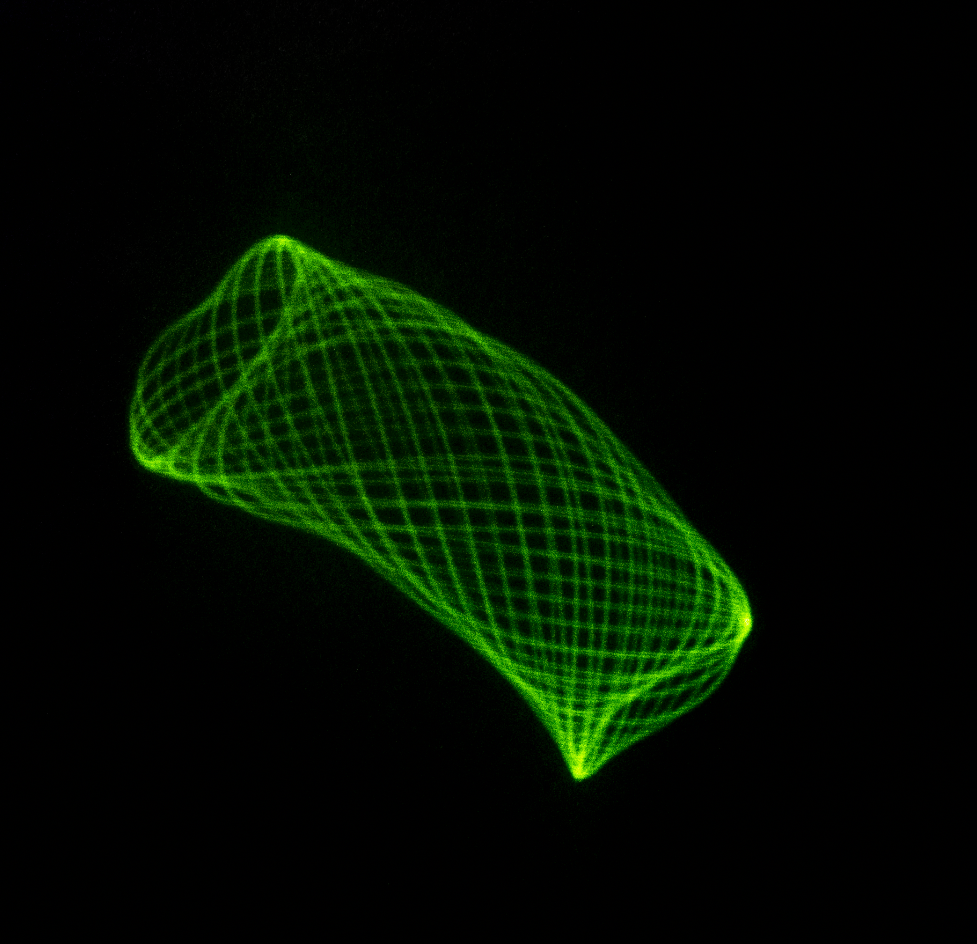 Fig. 54
 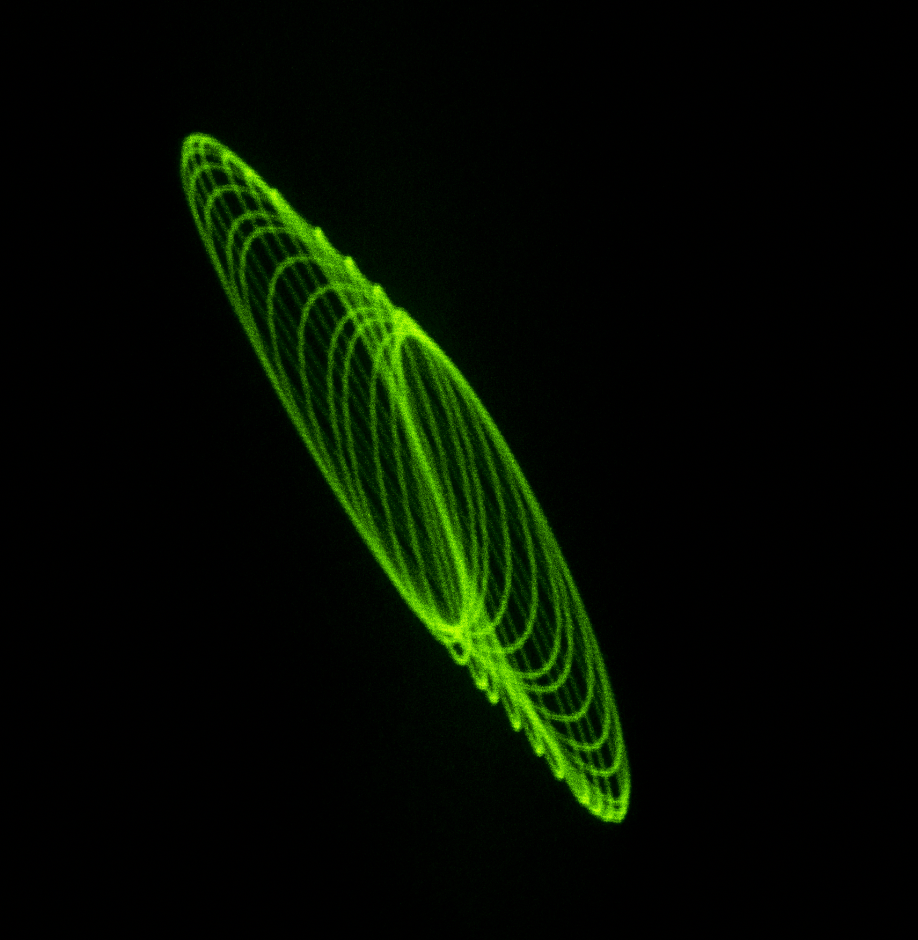 Fig. 55
 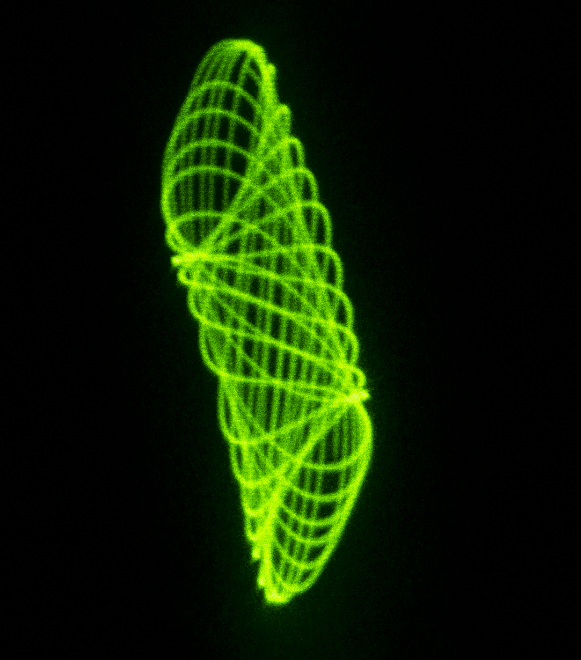 Fig. 56
 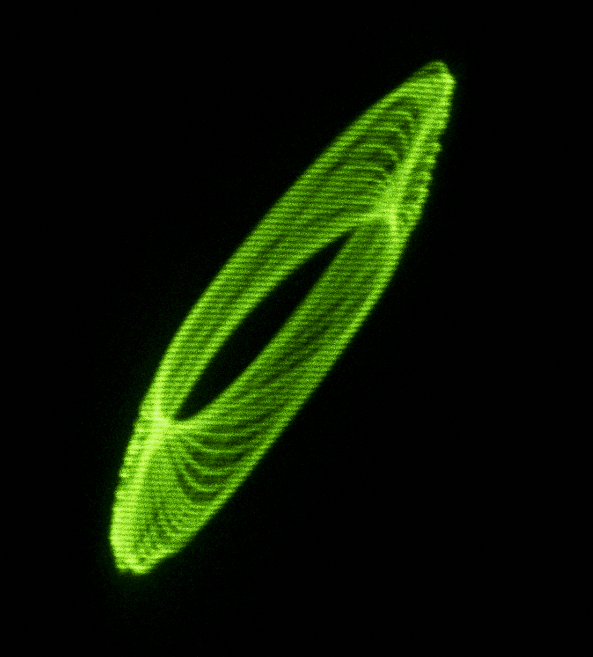 Fig. 57
 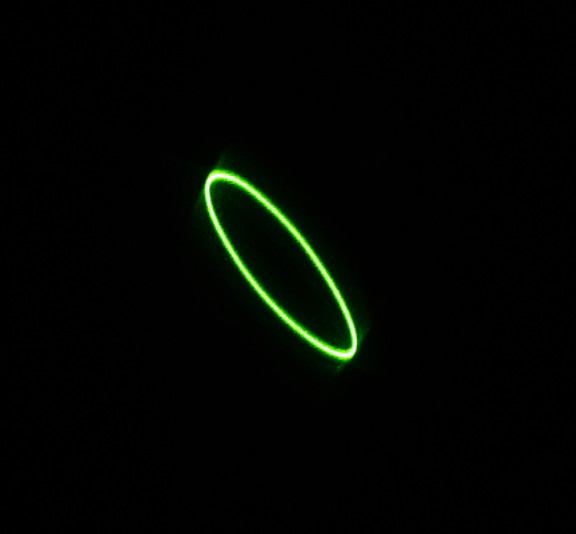 Fig. 58
 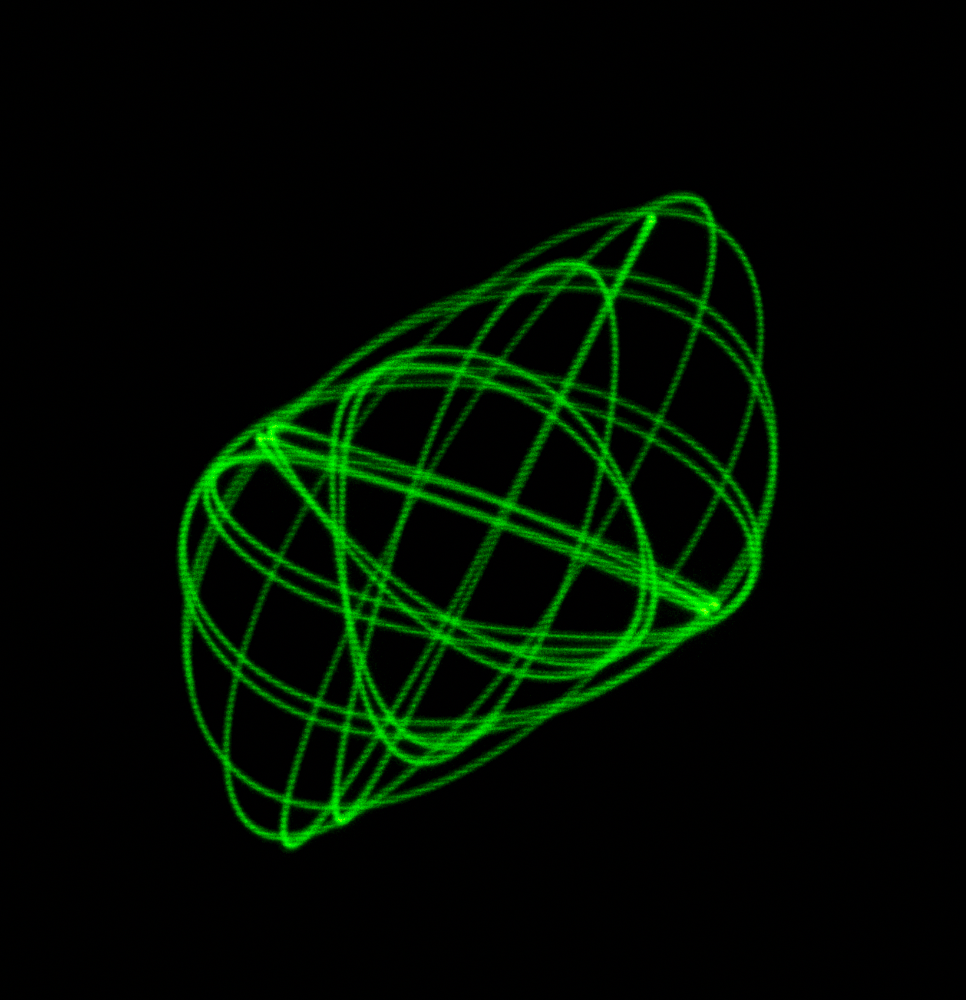 Fig. 59
 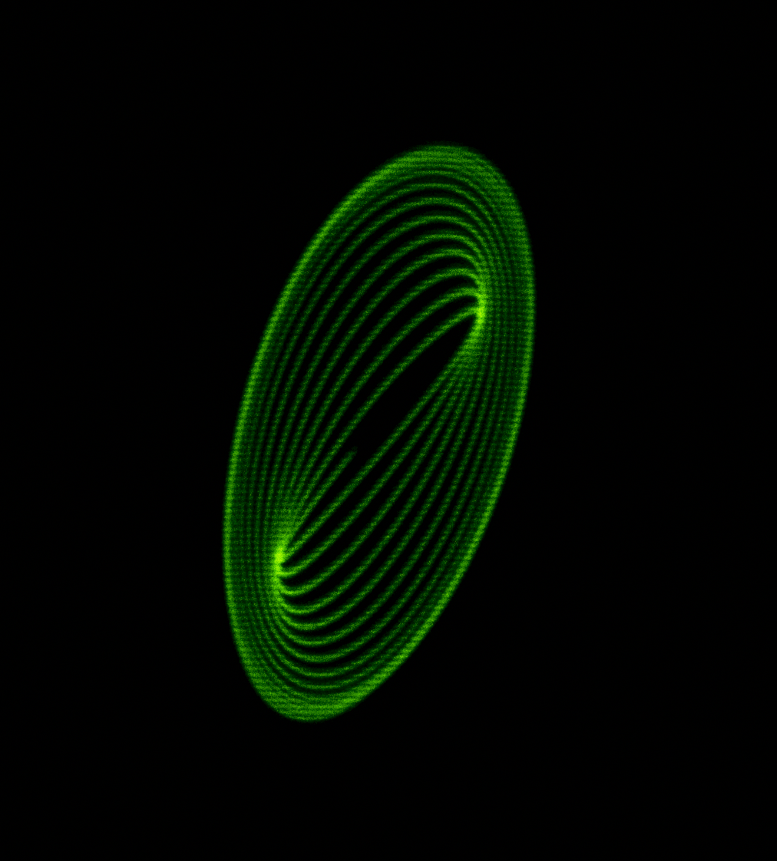 Fig. 60
Through my effort to find more combinations, I discovered that in mediation frequencies are used to heal trauma or physical pain on humans’ bodies. I was also almost shocked to learn that we can even create music from plants.
There are several types of frequencies that have been used in the mediation world such as, Universal, Cosmic, Sacred, Natural (or resonant) and Healing frequencies.
Personally, I did experiment with all of them but I will only list a few of them from the sacred frequencies, which happen to be the most used ones.
• UT – 396Hz – the key of G. (fig. 61) This is a low frequency which is believed to relieve guilt, fear and trauma. It is supposed to be useful in clearing traumas from sexual abuse in particular and the effects released from the body in a surge of stronger emotions, usually crying or laughing. It is also used to repair energy issues regarding sexuality.
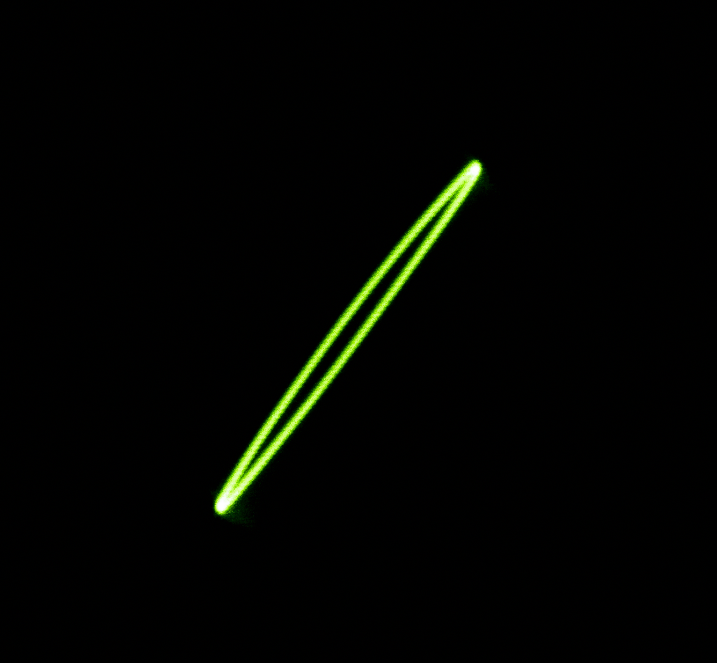 Fig. 61
• RE – 417 Hz – the key of G sharp (fig. 62). This frequency is a creativity booster. It allows the listener to let go of dogmatic stress and embrace the creative side. In physical terms, it is a muscle relaxant, helping with lethargy and removing (or preventing) low energy blocks in the spiritual being.
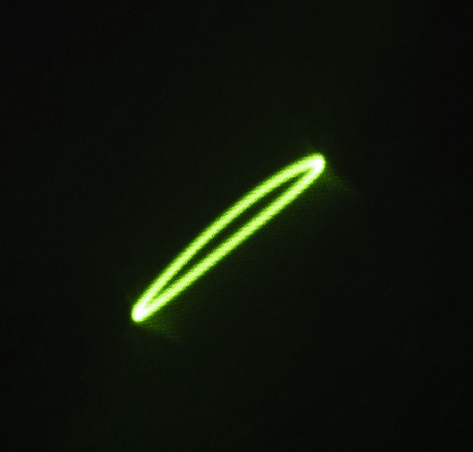 Fig. 62
• MI – 528 Hz – the key of C (fig. 63). This is known as the frequency of love. It brings about transformation and miracles in a person’s life by restructuring the DNA back to its perfect state. It is very good for anxiety, pain relief, weight loss, and to reprogram the brain [18] into more positive thinking and mindful attitude.
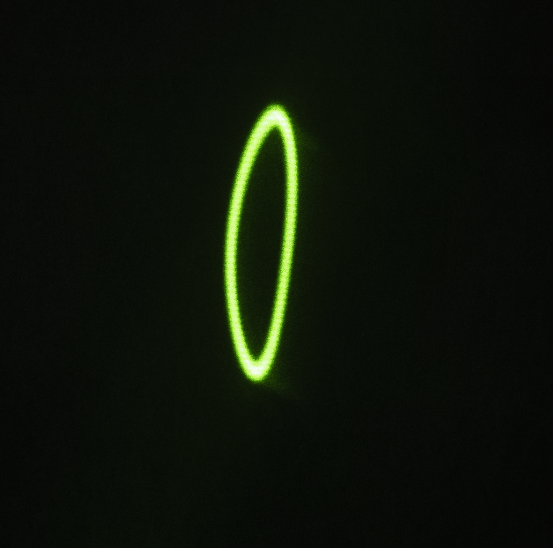 Fig. 63
• FA – 639 Hz – the key of E flat. E flat is one of the sounds that seem deep and profound. The use of E flat in meditation or spiritual healing is linked to vulnerability, getting to the deepest facets of the soul and allowing for healthy relationships and inner connectivity.
• SOL – 741 Hz – the key of F sharp. This frequency deals with areas of empowerment and is concerned with speaking one’s inner truth. It also governs self-confidence. It is said to cleanse the body’s cells from toxins and electromagnetic radiation. This frequency is helpful for generating ideas, clear speaking, creative thinking, and increasing self-confidence[19] and is thereby more focused on physical and mental recovery.
• LA – 852 Hz – the key of A. The A key is highly effective in work with the spiritual self. It is influential on dreams, deity connections and astral projection. The main assets of this key are the expanded understanding of self, clarity and assurance.
• SI – 963 Hz – the key of B. As well as replicating the benefits associated with the A key, this frequency establishes ethereal connections. This could be with the higher self, angels ascending masters or higher dimensions/realms of consciousness.
Later, two other frequencies were identified, making for three sets of three to mimic the sacred number of 9. These were:
• 174 Hz – the key of F(fig. 64). This is the lowest tone of the Solfeggio scale and is considered a type of energy-based anaesthesia as it is most potent in reducing pain in the physical body. It also takes out kinks and blockages in the energy channels which might make coping with pain easier. It makes people feel secure thanks to its slow and soothing qualities.
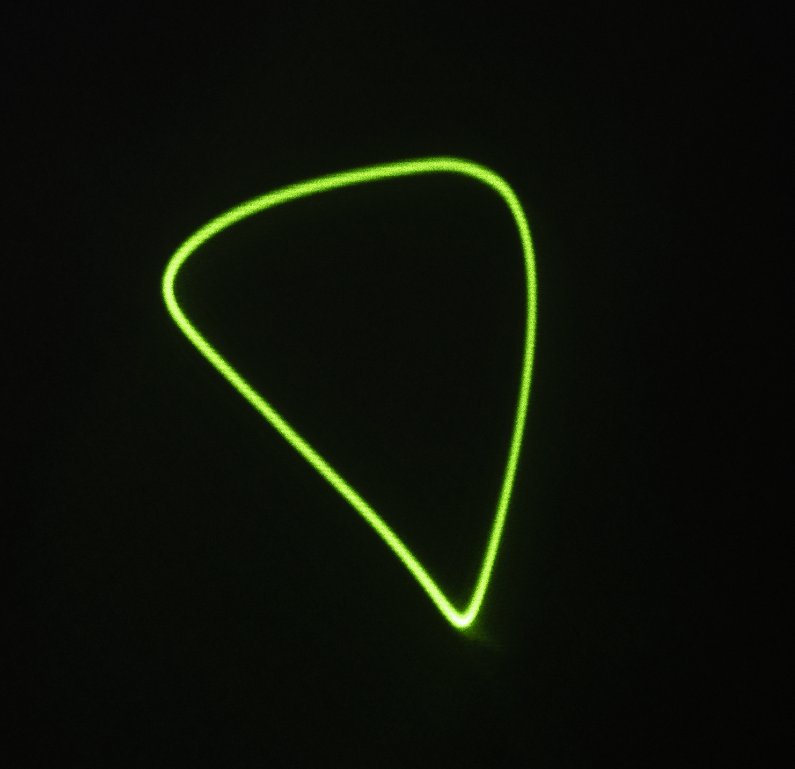 Fig. 64
• 285 Hz – the key of D (fig. 65). At just one level up from the lowest frequency, 285 Hz targets energy fields in an easily palatable and smooth way. It is most beneficial for addressing holes and other issues in a person’s aura or energetic field. This is a good frequency for chakra alignment and the frequency of choice for energy healers.[20]
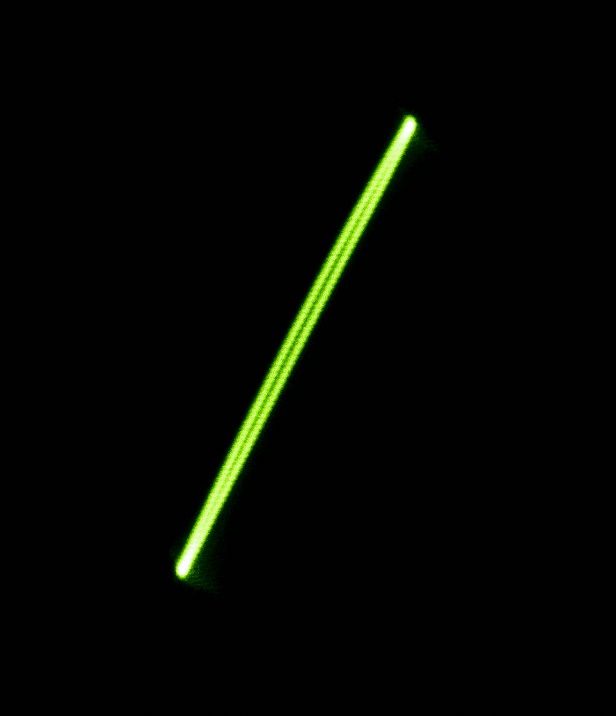 Fig. 65
For further details, please refer to my dissertation “Seeing Sound and Hearing Images.”
For the frequencies that I did not provide any images for, it is because the higher the frequency, the fewer vibrations the speaker generates. Which means the amplitude (volume) needs to be bigger or use a bigger full range speaker.
As every project has its difficulties, the same happened to this project as well. Because of the nature of the frequencies, I had many complaints from my neighbour below, so I could not work exactly correctly as I wanted.
As mentioned before, when combining two or more frequencies through the same source, more harmonical shapes can be generated. Therefore, I decided to mix some of the sacred Frequencies from the Solfeggio scale and I will list below a few of the most interesting one.
- So when the frequency of love 528 Hz is mixed with the frequency 285 Hz which targets our energy field this is what we get. (fig. 66)
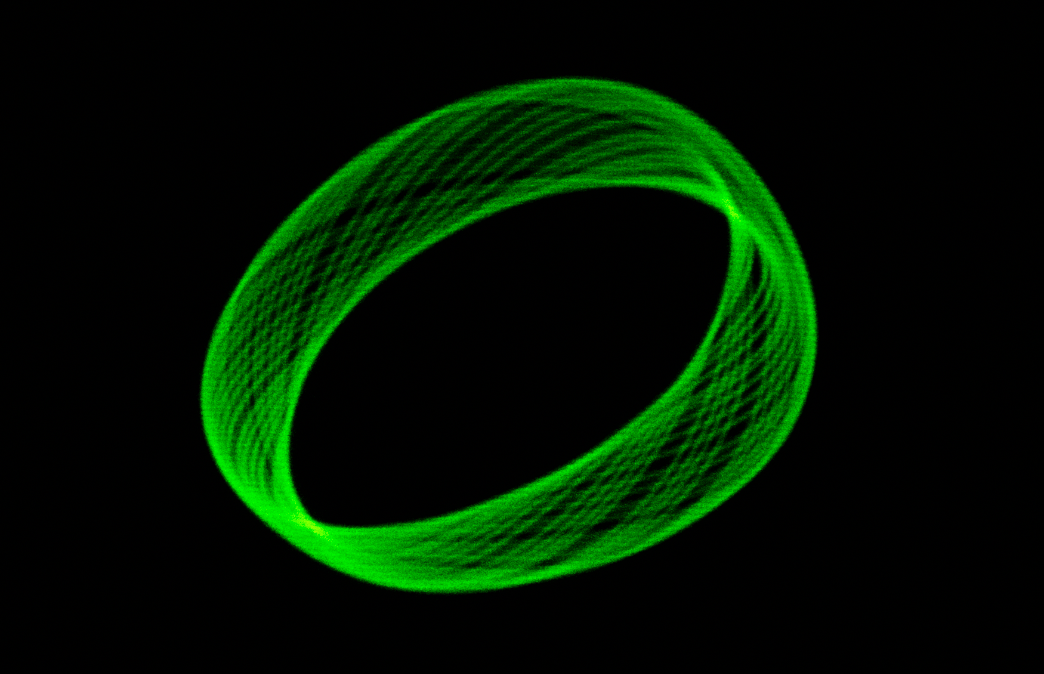 Fig. 66
- When mixing the same frequency of 285 Hz with the frequency 396 Hz which relieves guilt, fear and trauma this is the shape we can see (fig. 67)
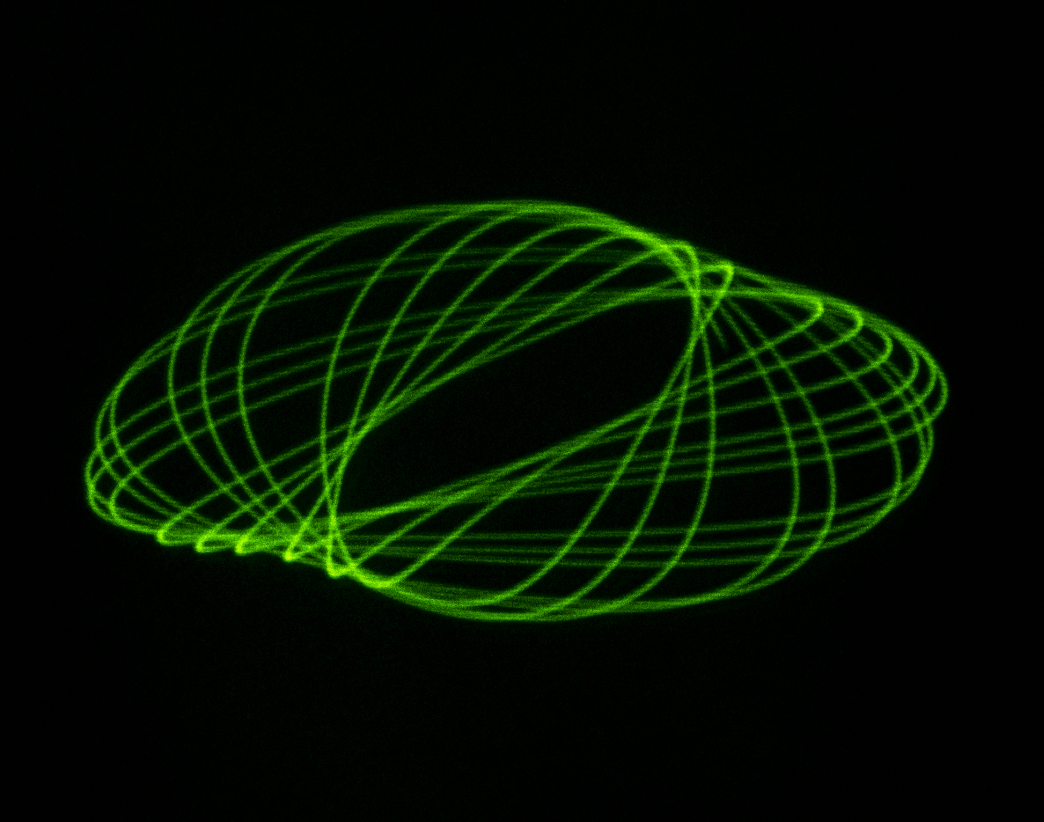 Fig.67
• If we keep the same frequency 285Hz and combine it with the frequency 417 Hz, which can boost our creativity this is what happens (fig. 68).
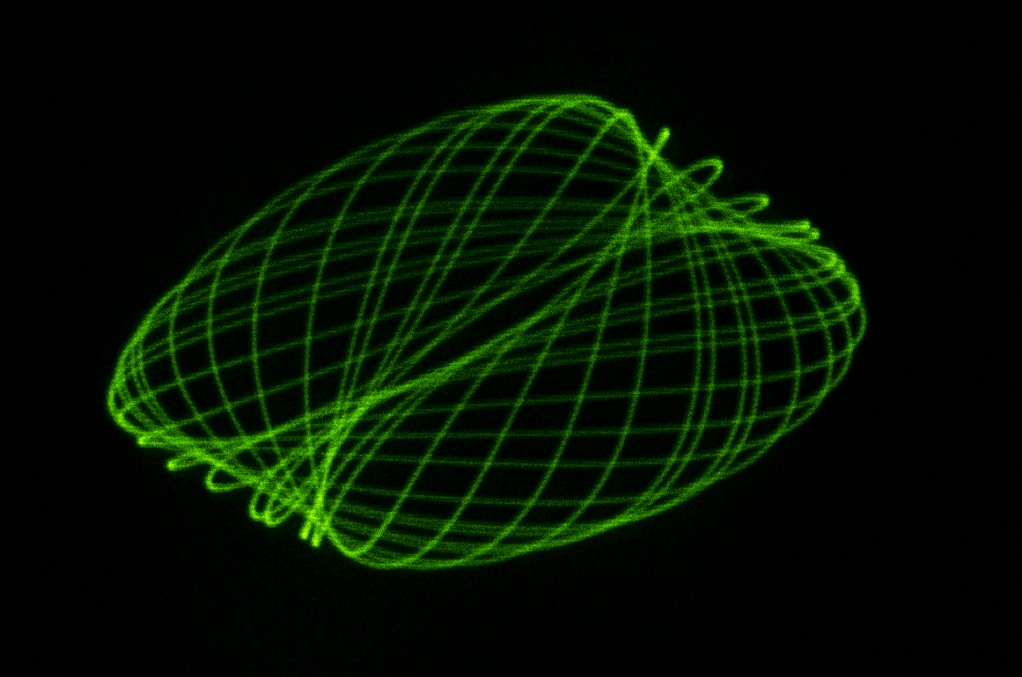 Fig. 68
• If we keep the same frequency of 285 Hz again and combine it with the frequency of 174 Hz, which can reduce pain in the physical body (fig. 69) we can create that beautiful shape.
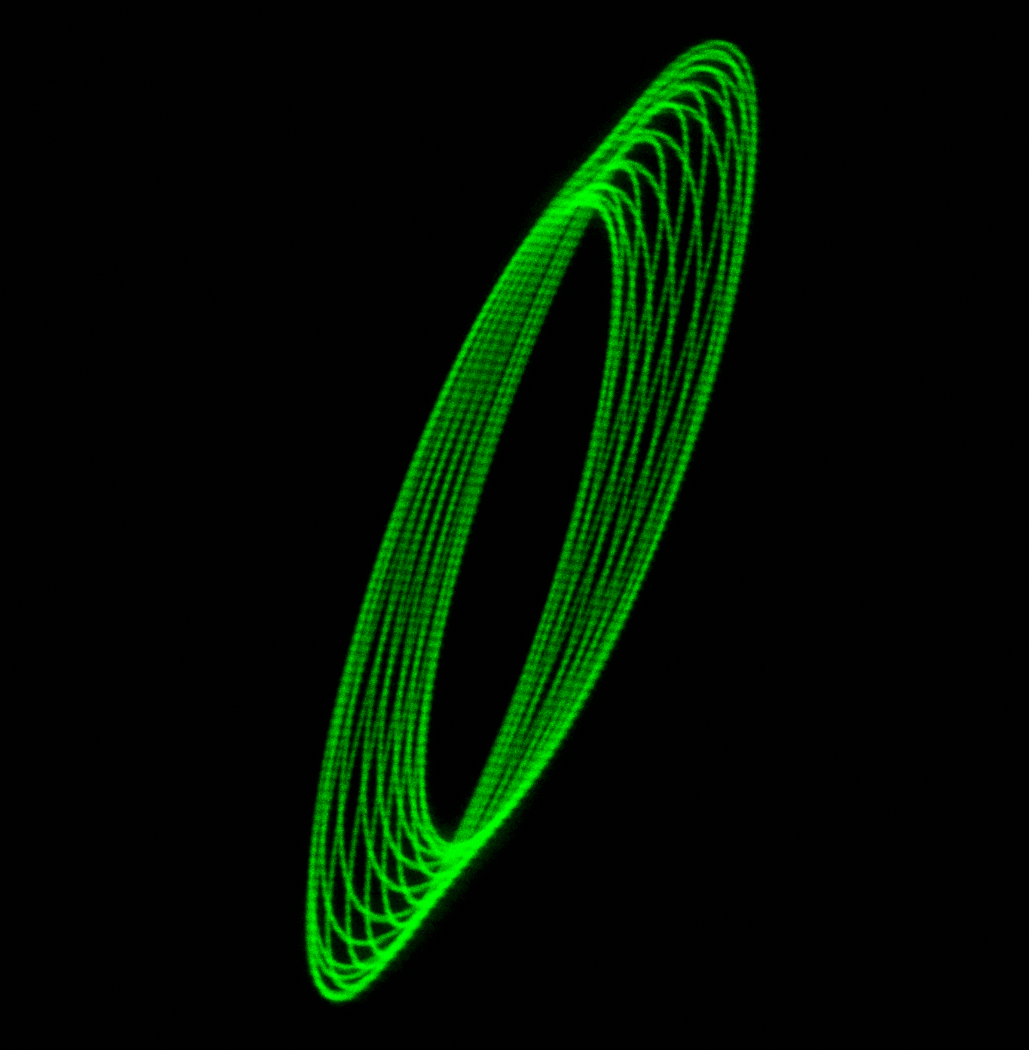 Fig. 69
• If now we mix the frequency 174 Hz with the frequency 417 Hz (fig. 70) we can see one of my favourites shapes.
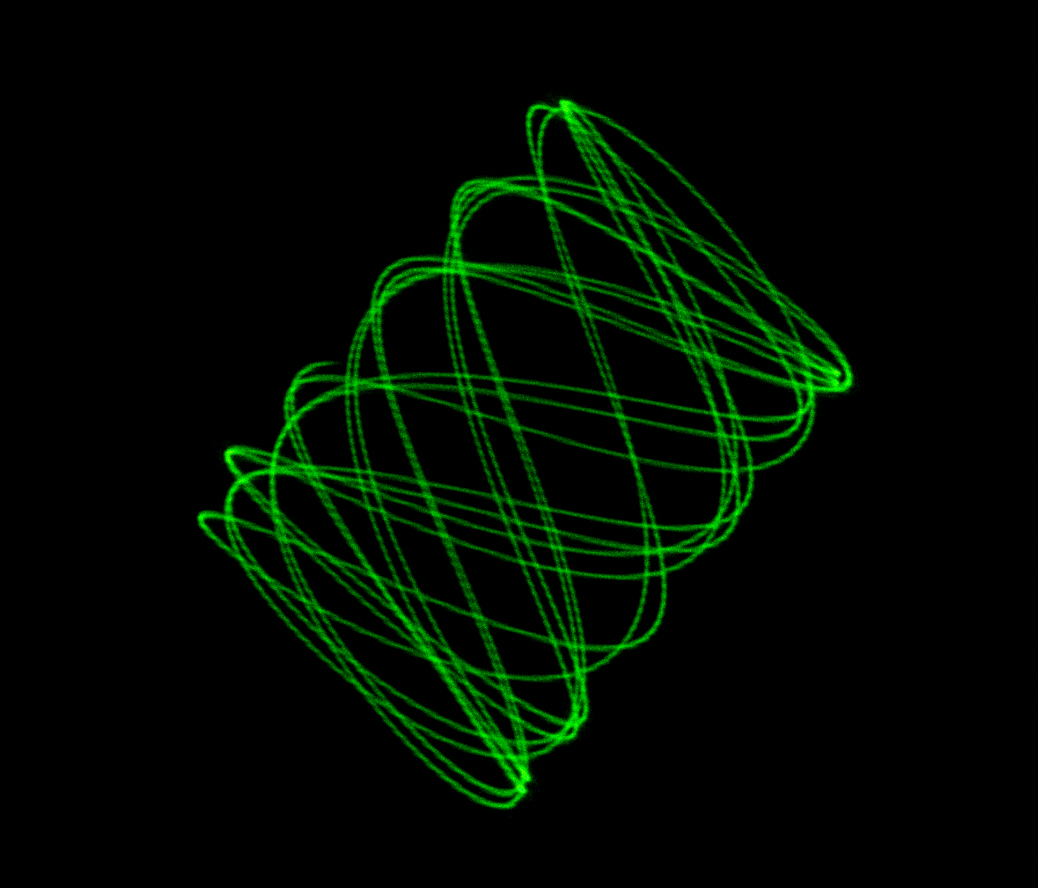 Fig. 70
• Lastly, if we combine three frequencies of 174 Hz, 285 Hz and 396 Hz (fig. 71) we get this amazing image.
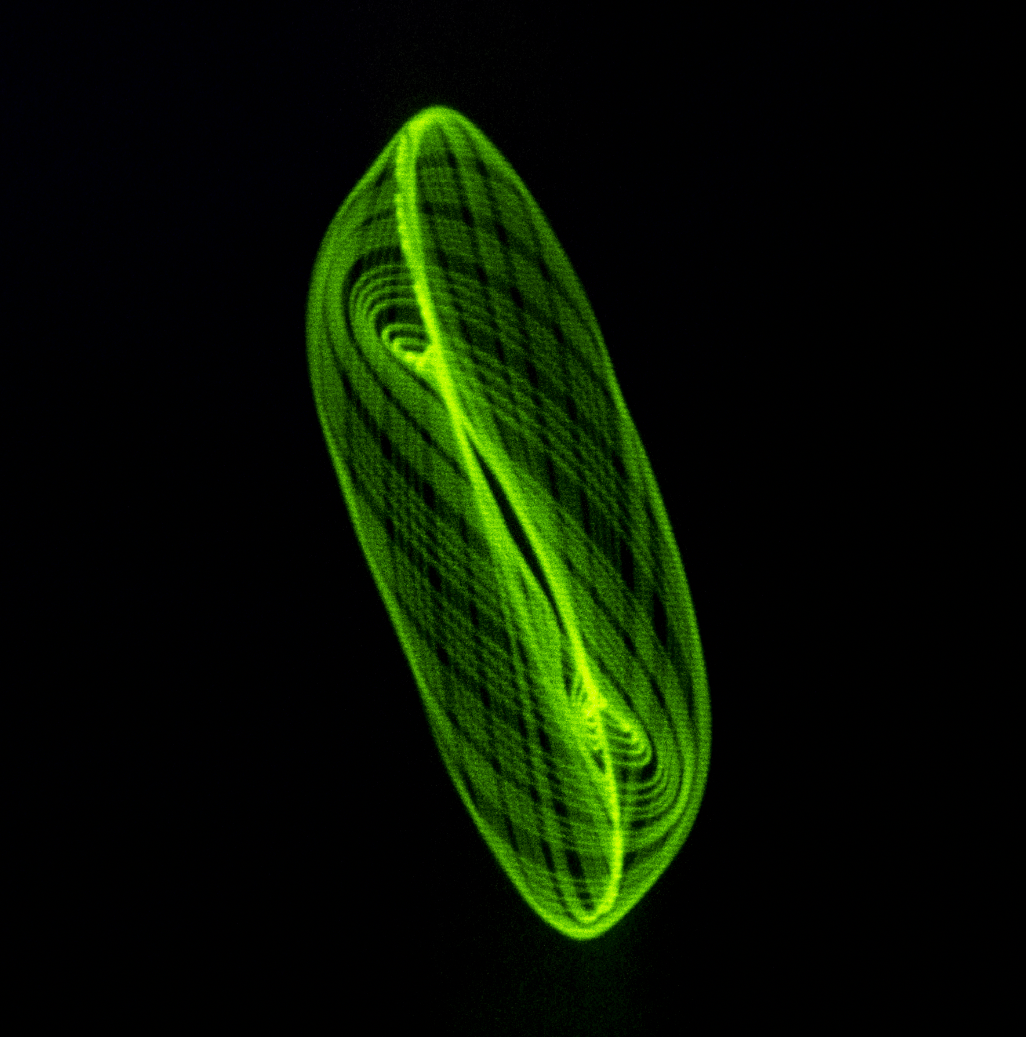 Fig. 71
I need to note that these photographs are not easy and straight forward results, as it requires loads of hours of research of what frequencies to use and why; we need to be very organised and methodical not to confuse which image we have but also we need to experiment with different settings on the camera to capture whatever we see with our eyes. The most important thing to capture the right image is to adjust the shutter speed on the camera in order to capture what we see. On the next pictures, we are going to use the same frequencies with different settings on the camera so we can compare the differences. In this example, we use a third major interval of the note E (Mi) which consists of four semitones. The notes we are using here are the E (Mi) and G# (Sol Sharp).
The settings on the camera for the first image (fig. 72) are f/5.6, ISO 1000 and shutter speed of 1/20 of a second. For the second image (fig. 73), the settings are the same, but we will change the shutter speed to 1/15 of a sec.
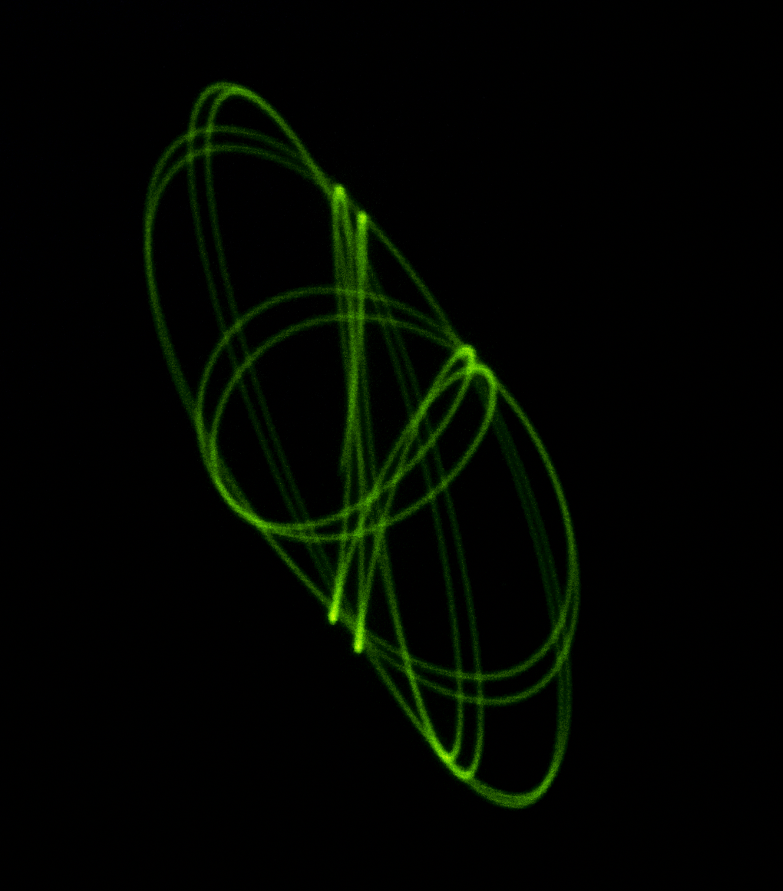 Fig. 72
 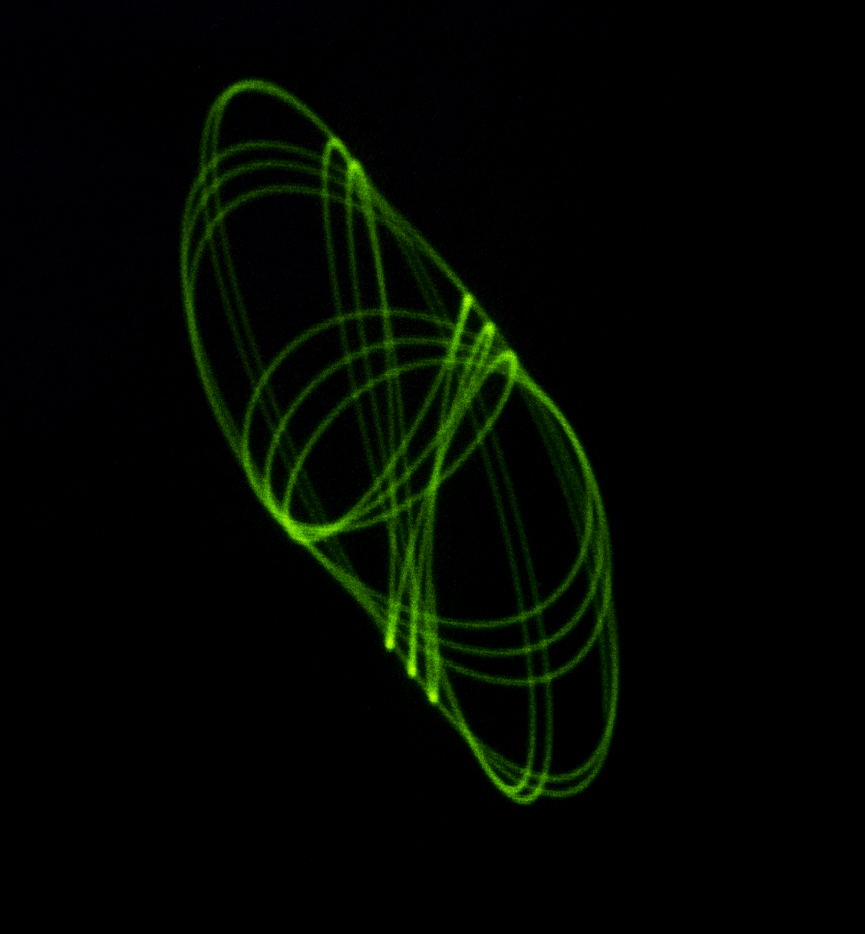 Fig. 73
On the third image (fig. 74), we are keeping the same settings, but we use a slower shutter speed of 1/13 of a second and on the fourth image (fig. 75), we use an even slower shutter speed of 1/10 of a second.
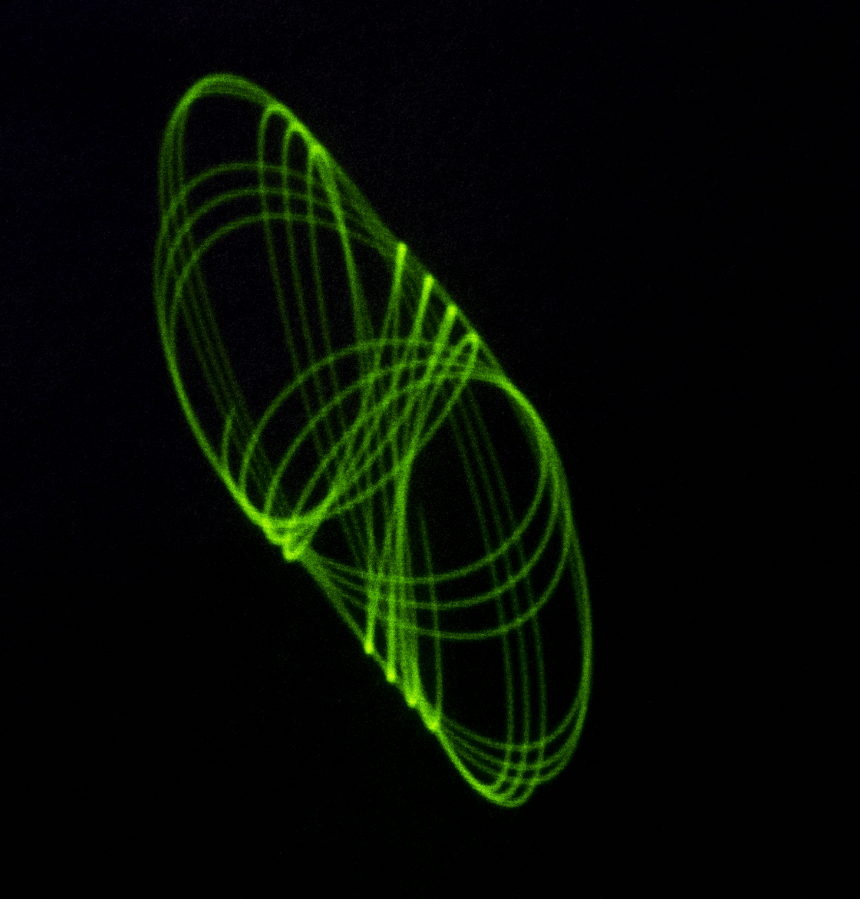 Fig. 74
 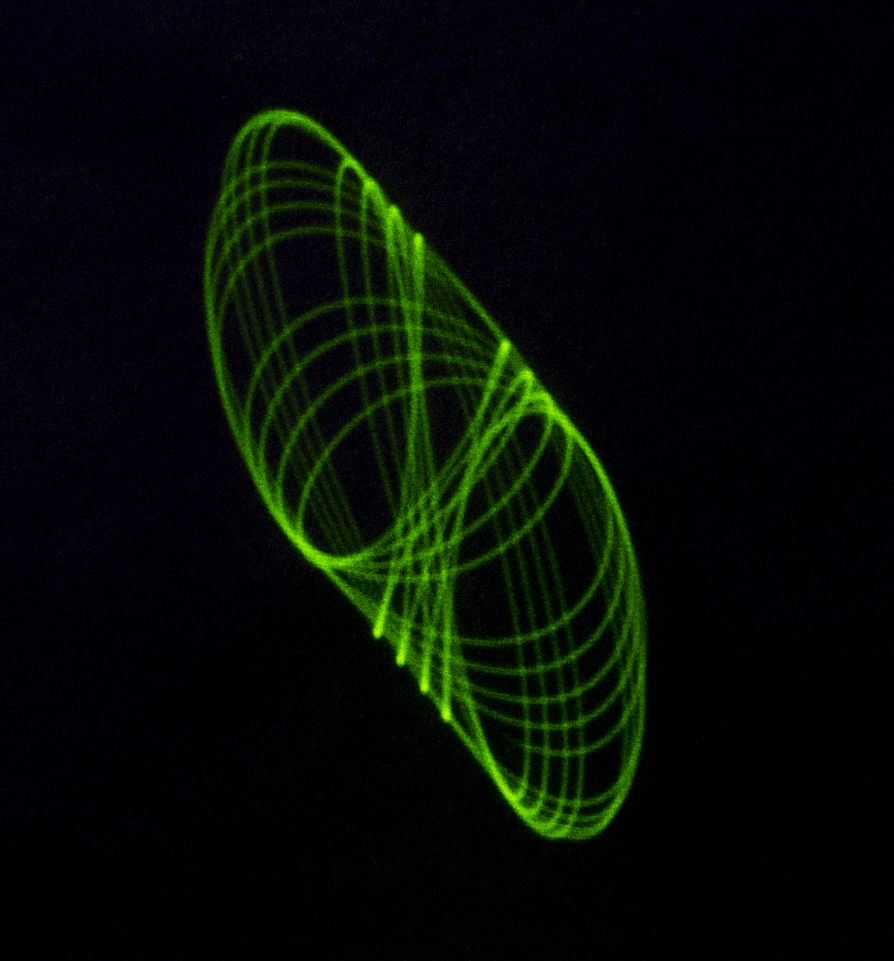 Fig. 75
Next, everything is kept the same but we alter the shutter speed again to 1/8 of a second for the fifth image (fig. 76) and 1/4 of a second for the sixth image (fig. 77)
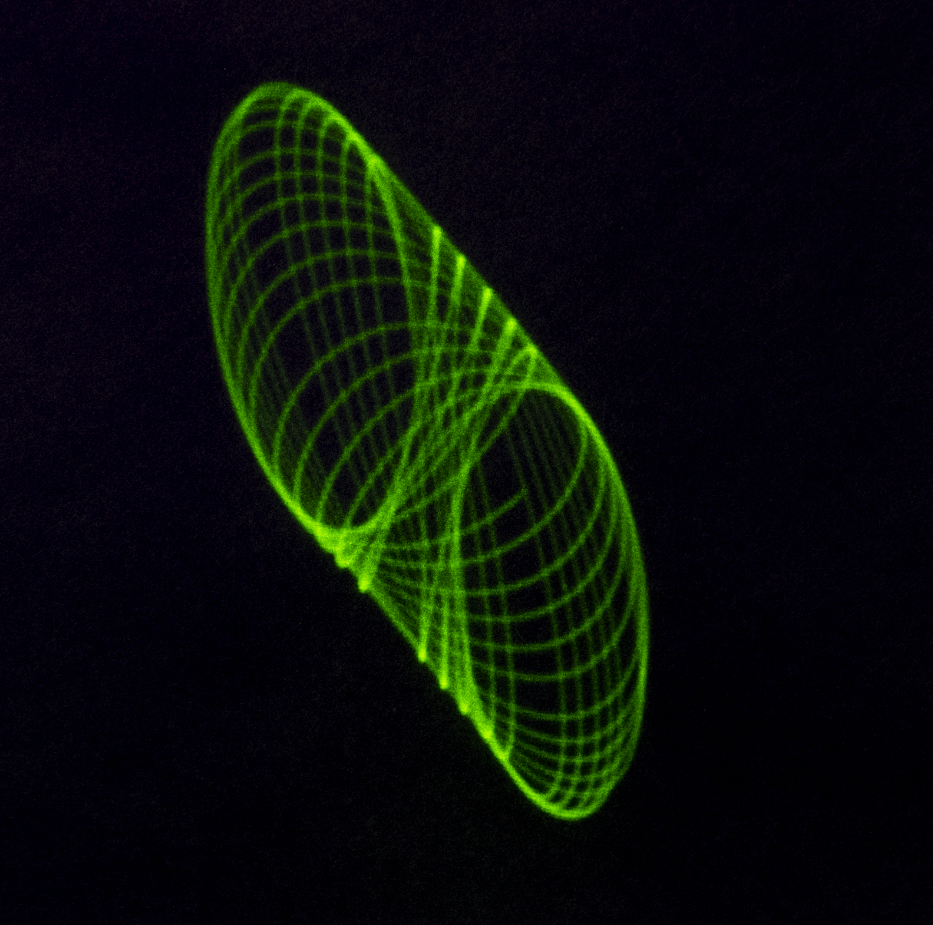 Fig. 76
 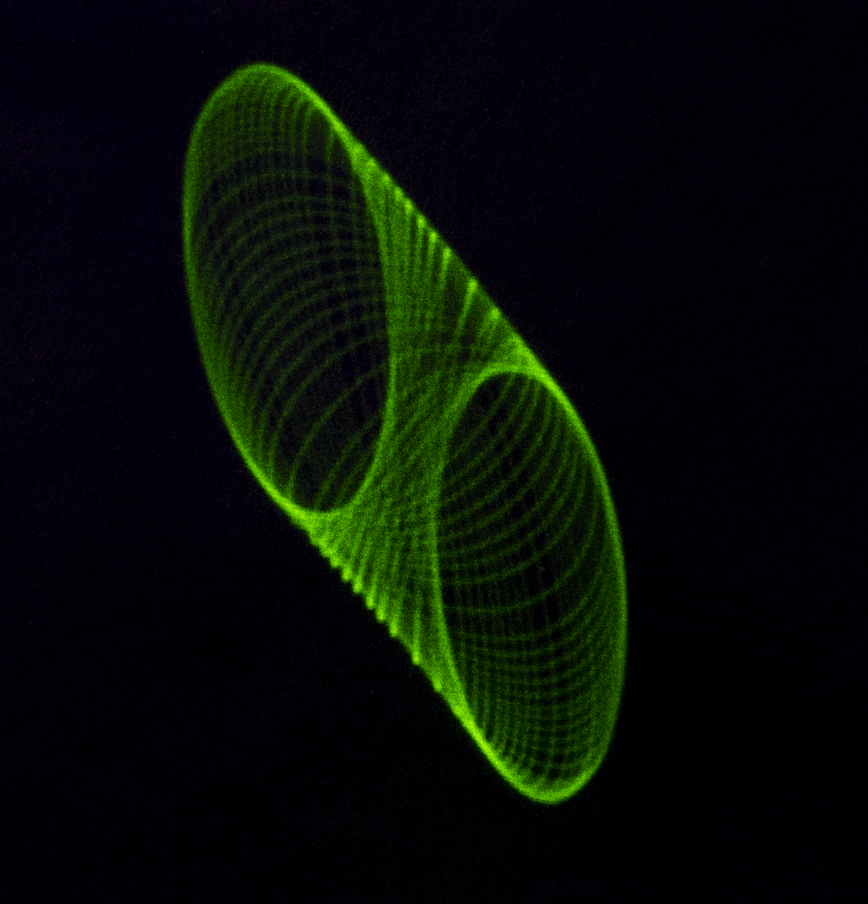 Fig. 77
Finally, on the last image (fig. 78) a shutter speed of 0.5 of a second is used which is almost identical to the one I was watching with my bare eyes.
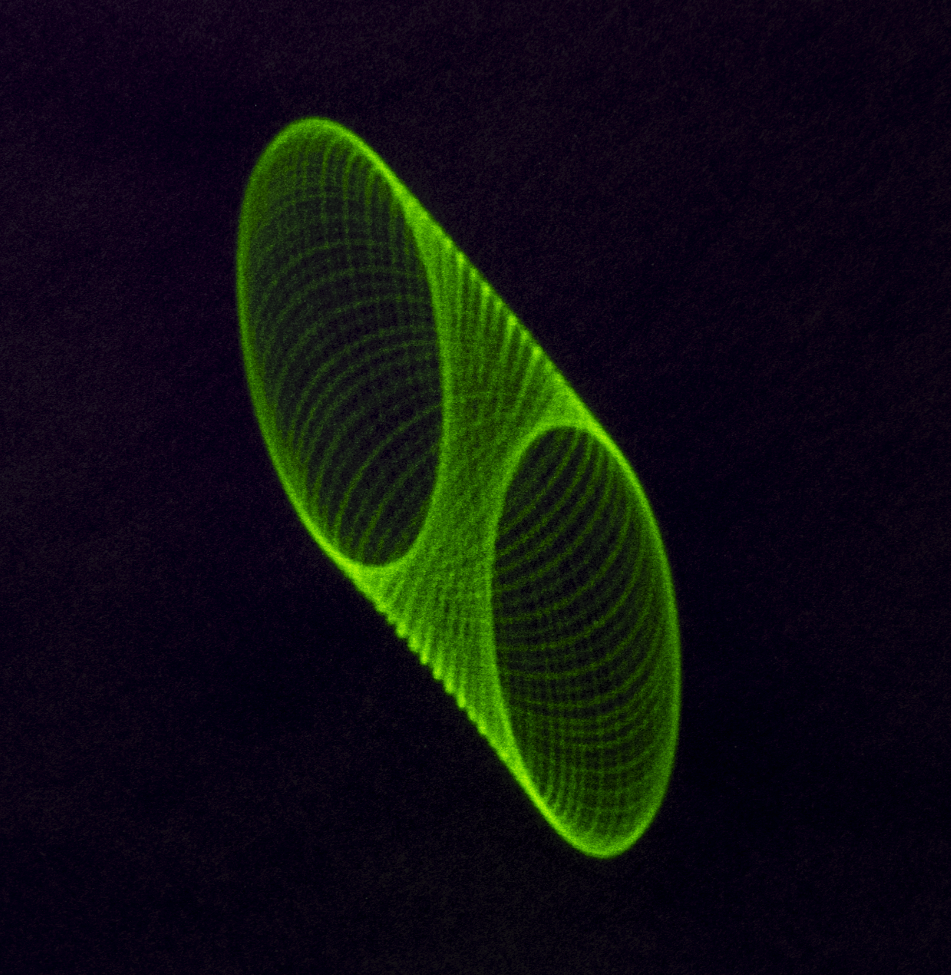 Fig. 78
These setting are not standard for every frequency. For every frequency, we need to apply different settings in order to achieve the most realistic results.
Another crucial aspect determining movement on the surface is the material that the laser will reflect on but also the density of the material that the frequency will pass through. Additionally, the distance from the source of sound is another vital aspect along with the size and type of the speaker, which will affect the final results. It terms of the background it is as important as the other aspects, as first the texture of the material will affect the final results but the colour is very important as well. Because a green laser which is very powerful is used, a black colour is needed to absorb the majority of the light so that it won’t not reflect it back. I tried three different backgrounds as we can see from the pictures. A black cotton 3x6m backdrop, a 2x1m black floor matt, and a black 1.5m x11m paper backdrop. Again best results depend on the camera settings and the post-production edit. I found that the paper backdrop works the best of all for my needs at this stage.
Before I ended up using the stretched balloon (fig. 79) as my main surface to transfer the vibrations of the frequencies as accurately as possible, I experimented with different materials such as a metallic bowl (fig. 80), a mild still plate and torch (fig. 81) a plastic plate with a small piece of mirror in the middle (fig. 82), an aluminium plate, a metallic reflected plate (fig. 83) and a stainless plate. Additionally, I bought some round embroidery hoops (fig. 79, 84) to keep the stretched balloon in place but also to allow me to experiment with other material such as cotton and nylon (fig. 84).
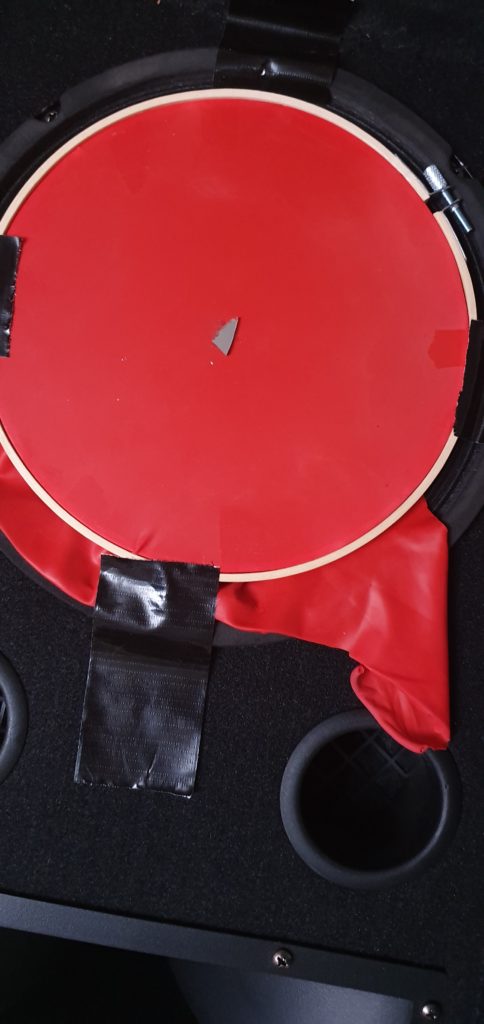 Fig. 79
 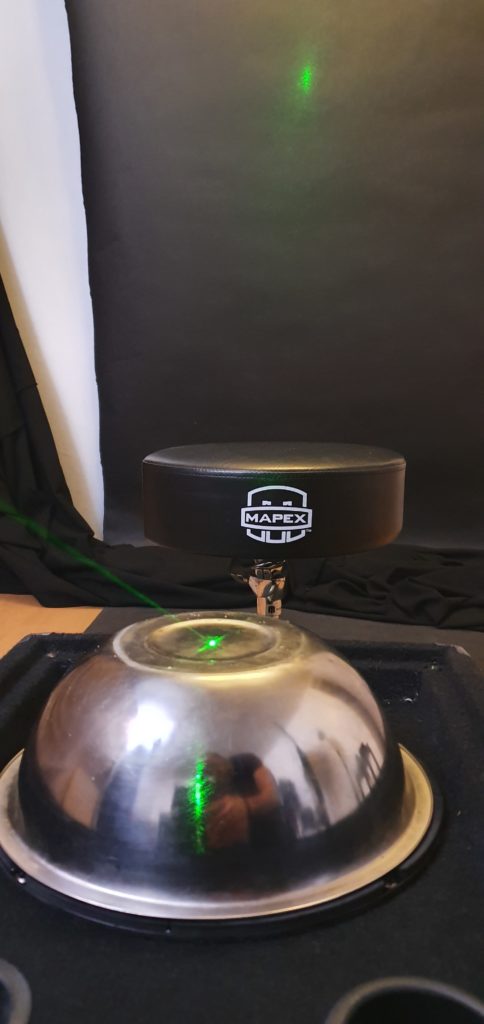 Fig. 80
 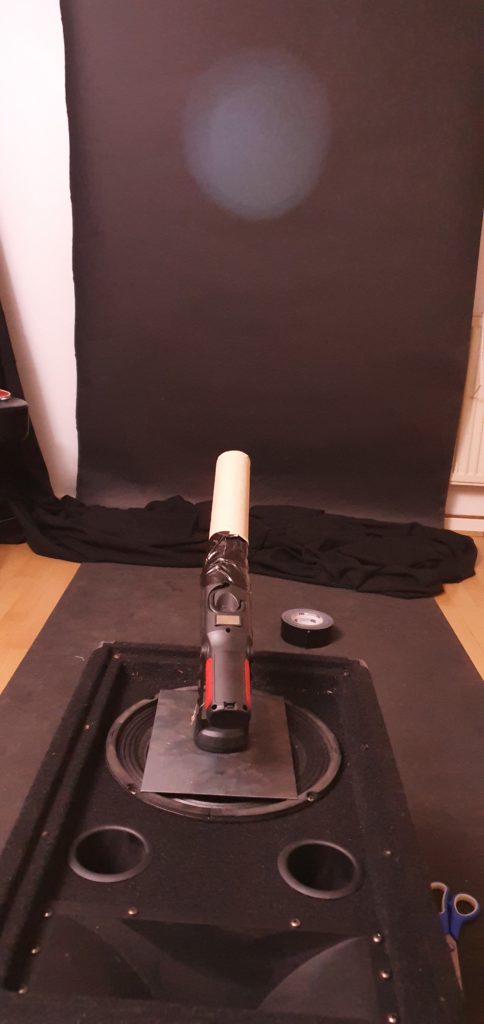 Fig. 81
 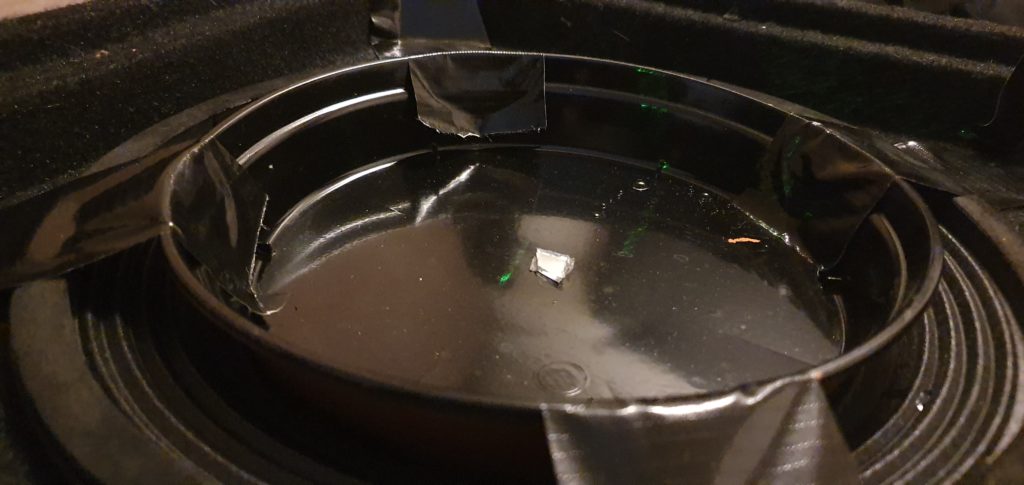 Fig. 82
 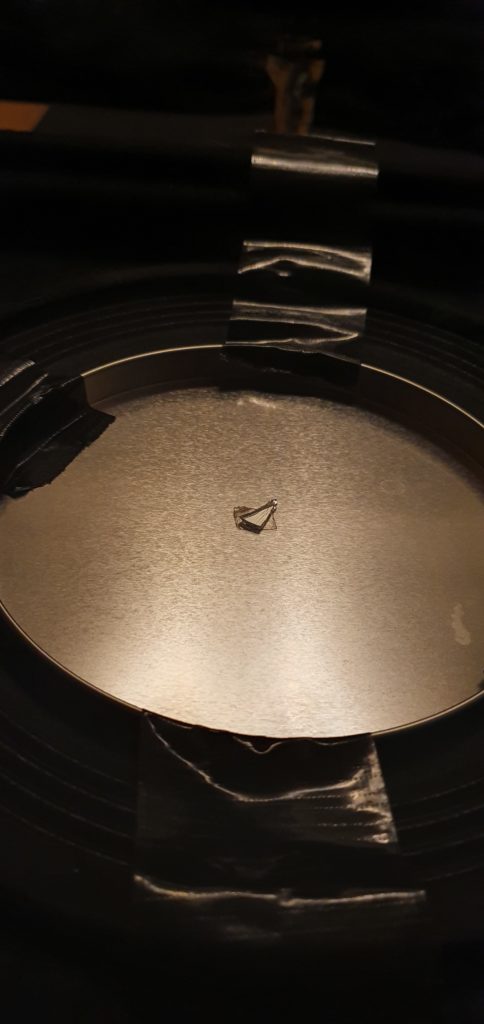 Fig. 83
 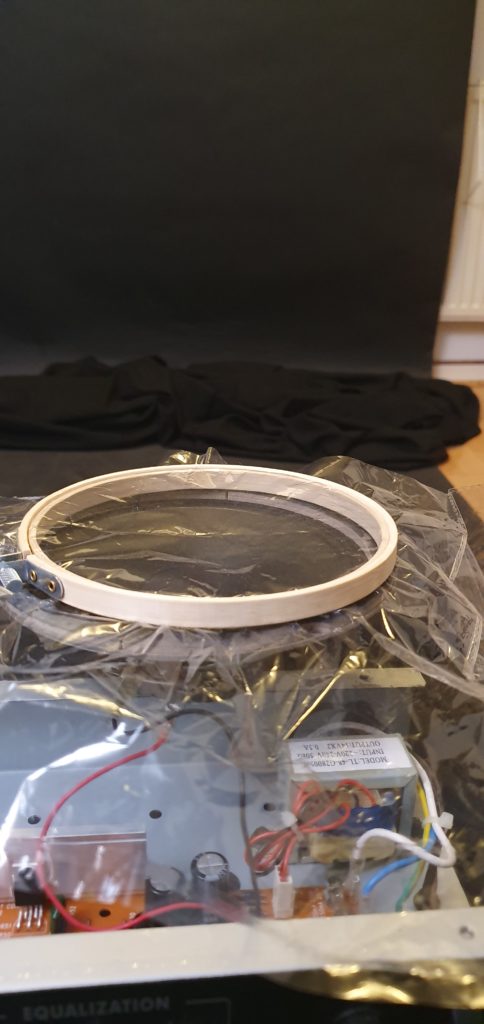 Fig. 84
Unfortunately, as we can see from the pictures, the results were not good at all but this is the point of trial and error. If we do not try new things, even if it looks wrong, we will never discover new approaches and new ideas.
Therefore, I wanted to make a few attempts to experiment with water and laser. Firstly, I filled up the metal plate (fig. 85) with water. The second time I filled the plastic plate with water (fig. 86) to see what would come up. Lastly, I filled a wine glass with water and let the laser pass through it (fig. 87).
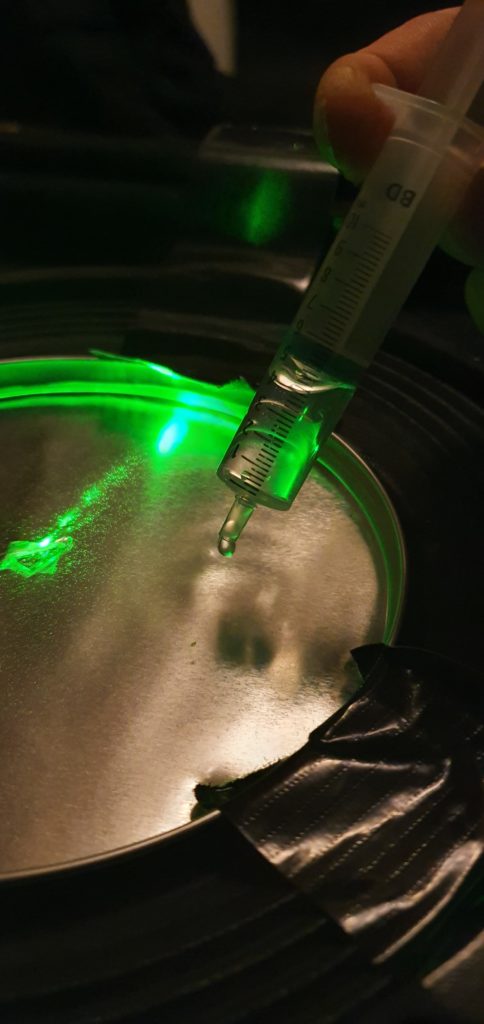 Fig. 85
 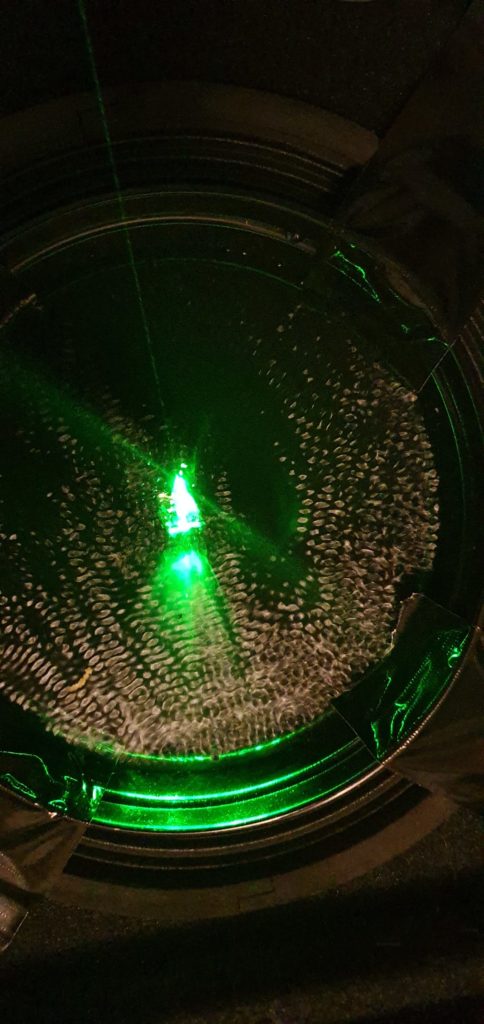 Fig. 86
 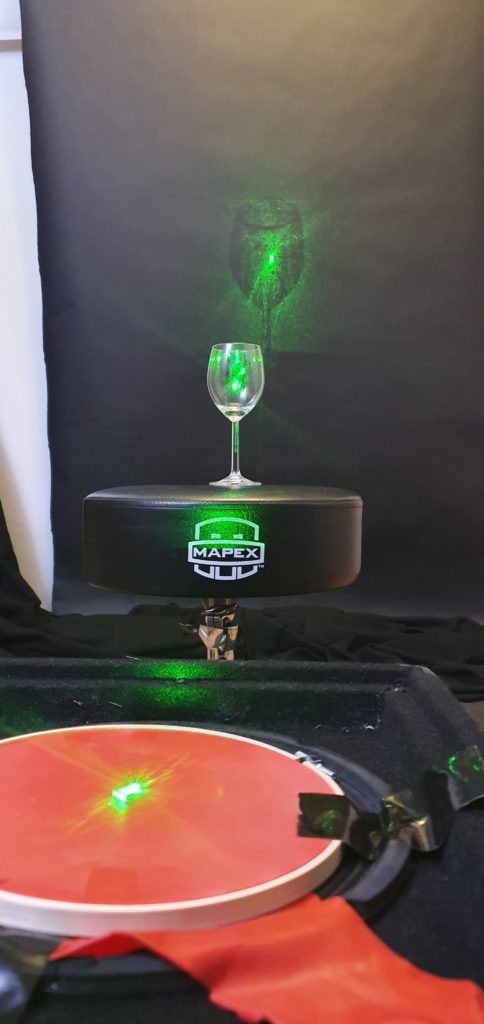 Fig. 87
Below we can see some of the results from the experiment with water (fig. 88 – 101).
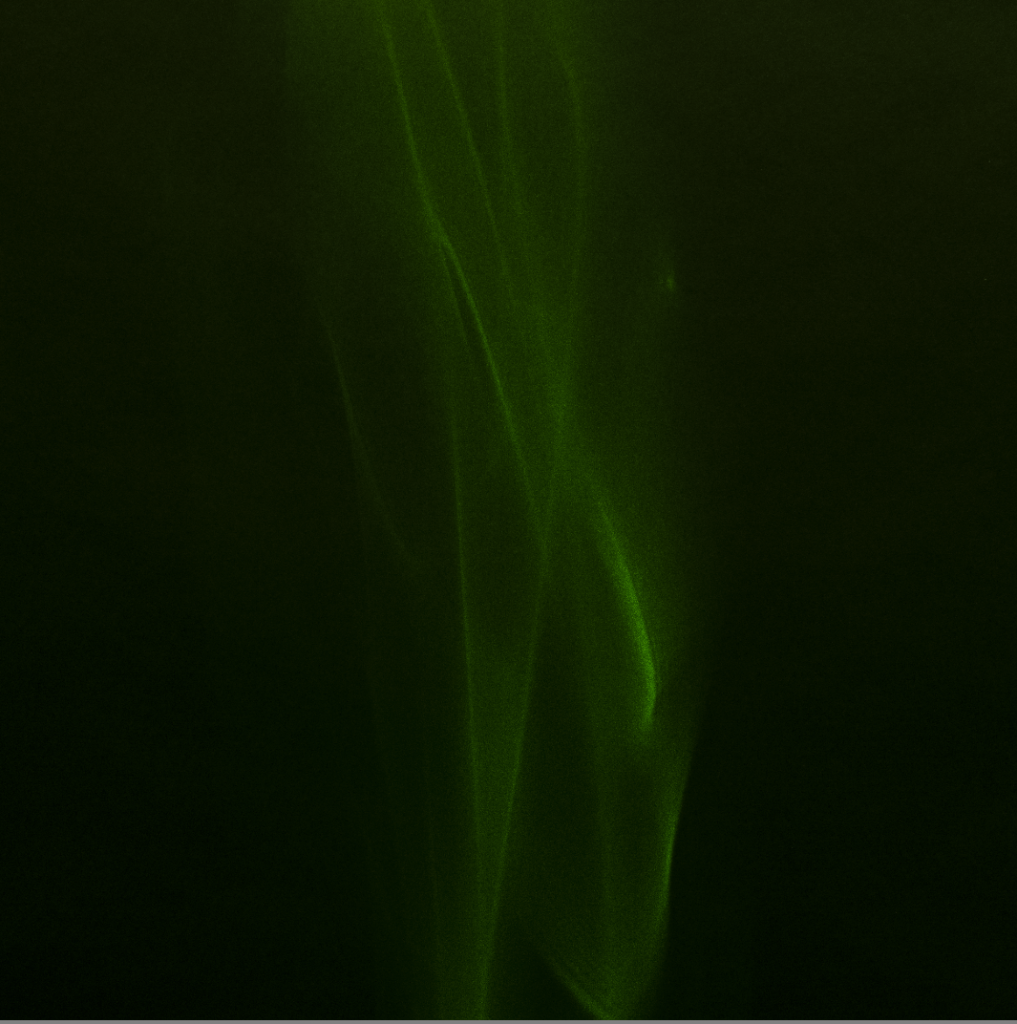 Fig. 88
 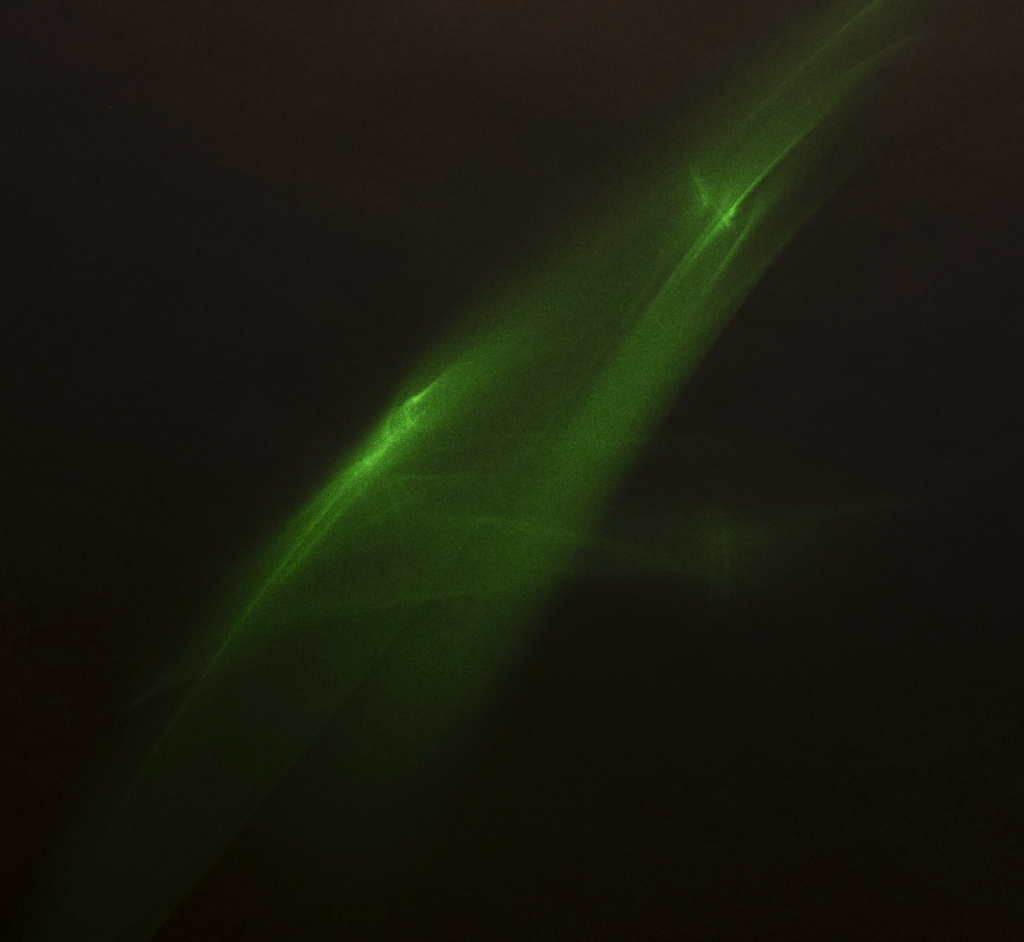 Fig. 89
 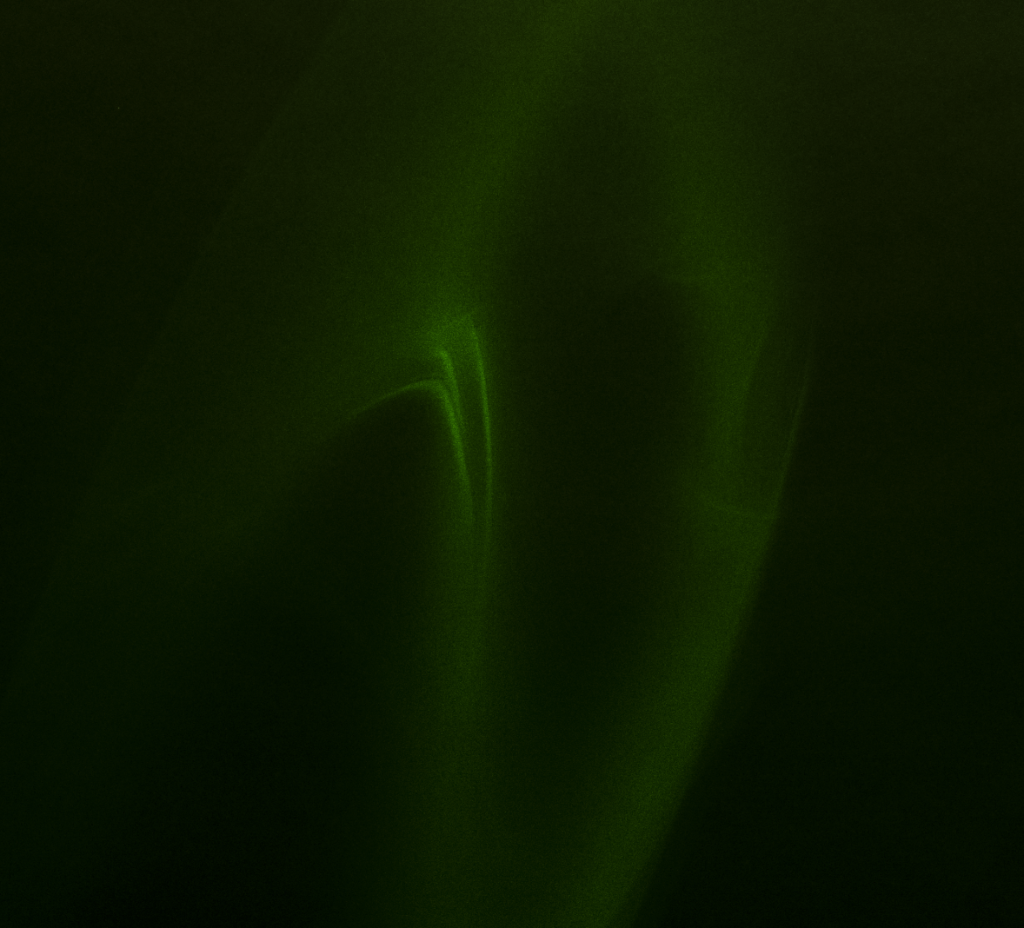 Fig. 90
 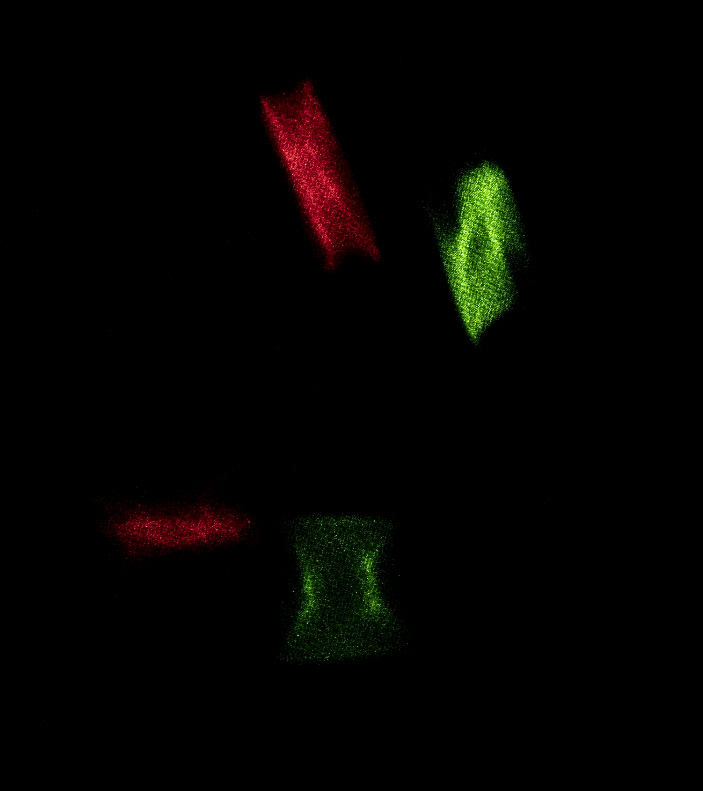 Fig. 91
 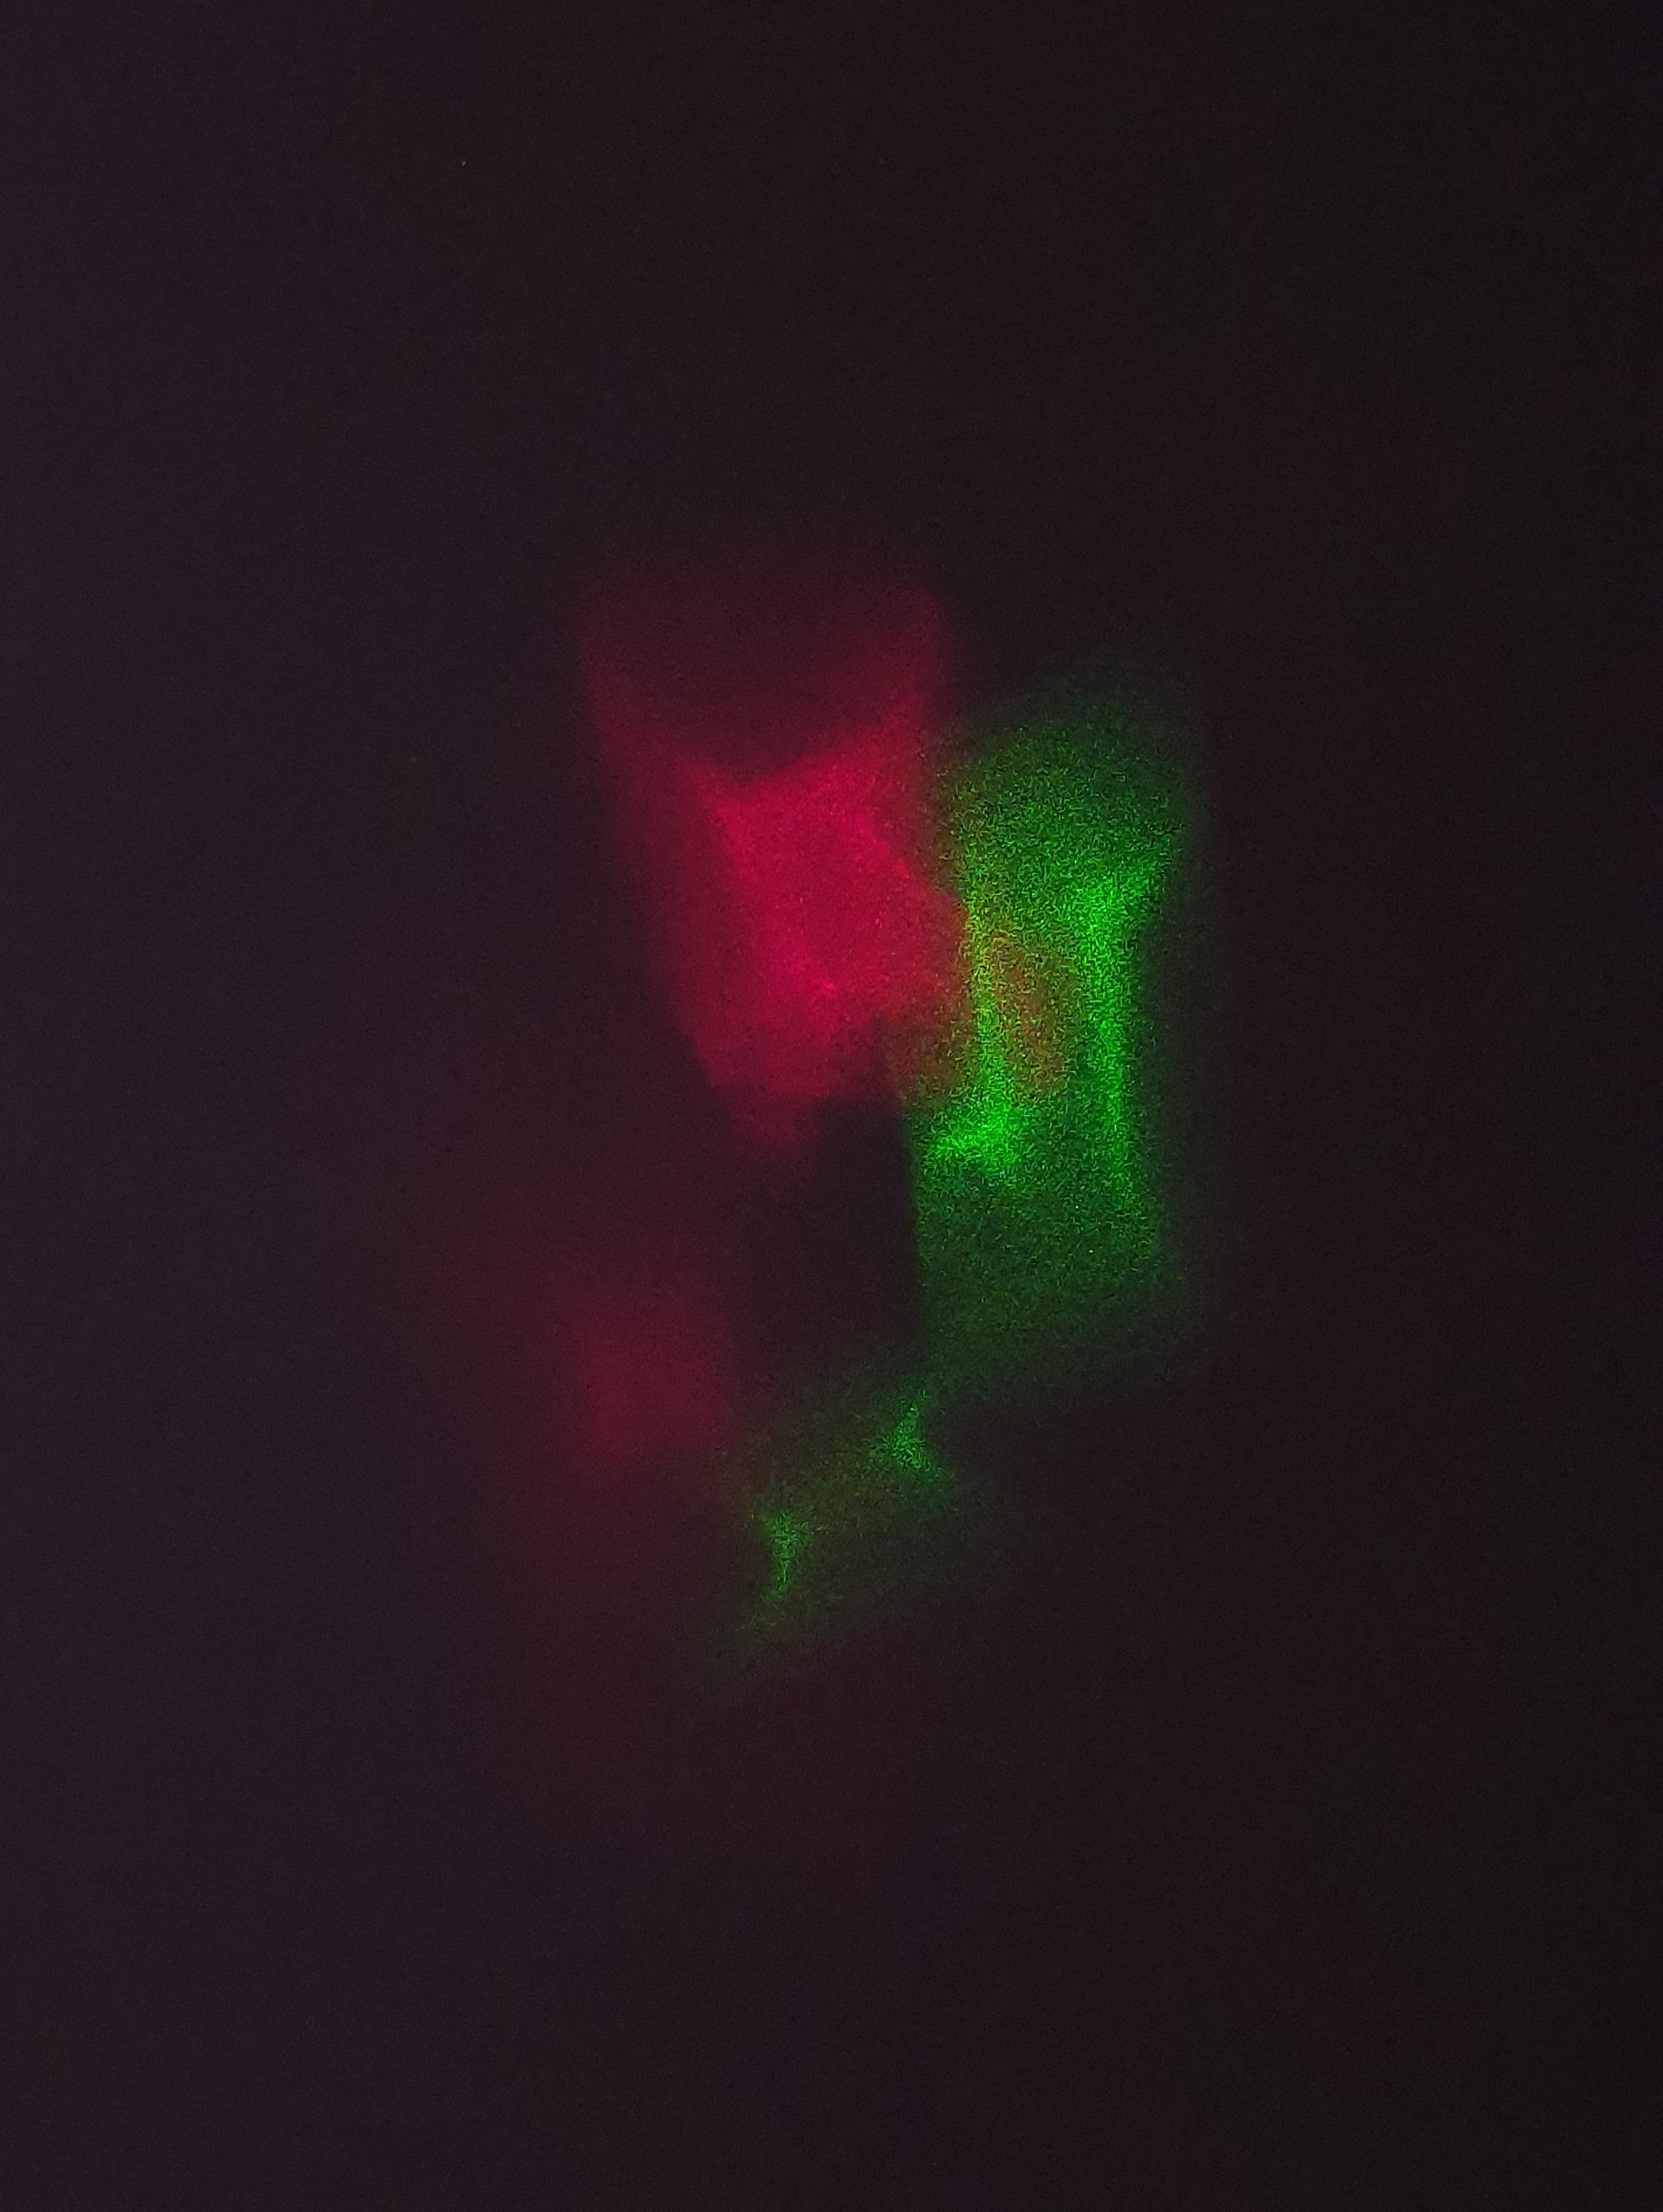 Fig. 92
 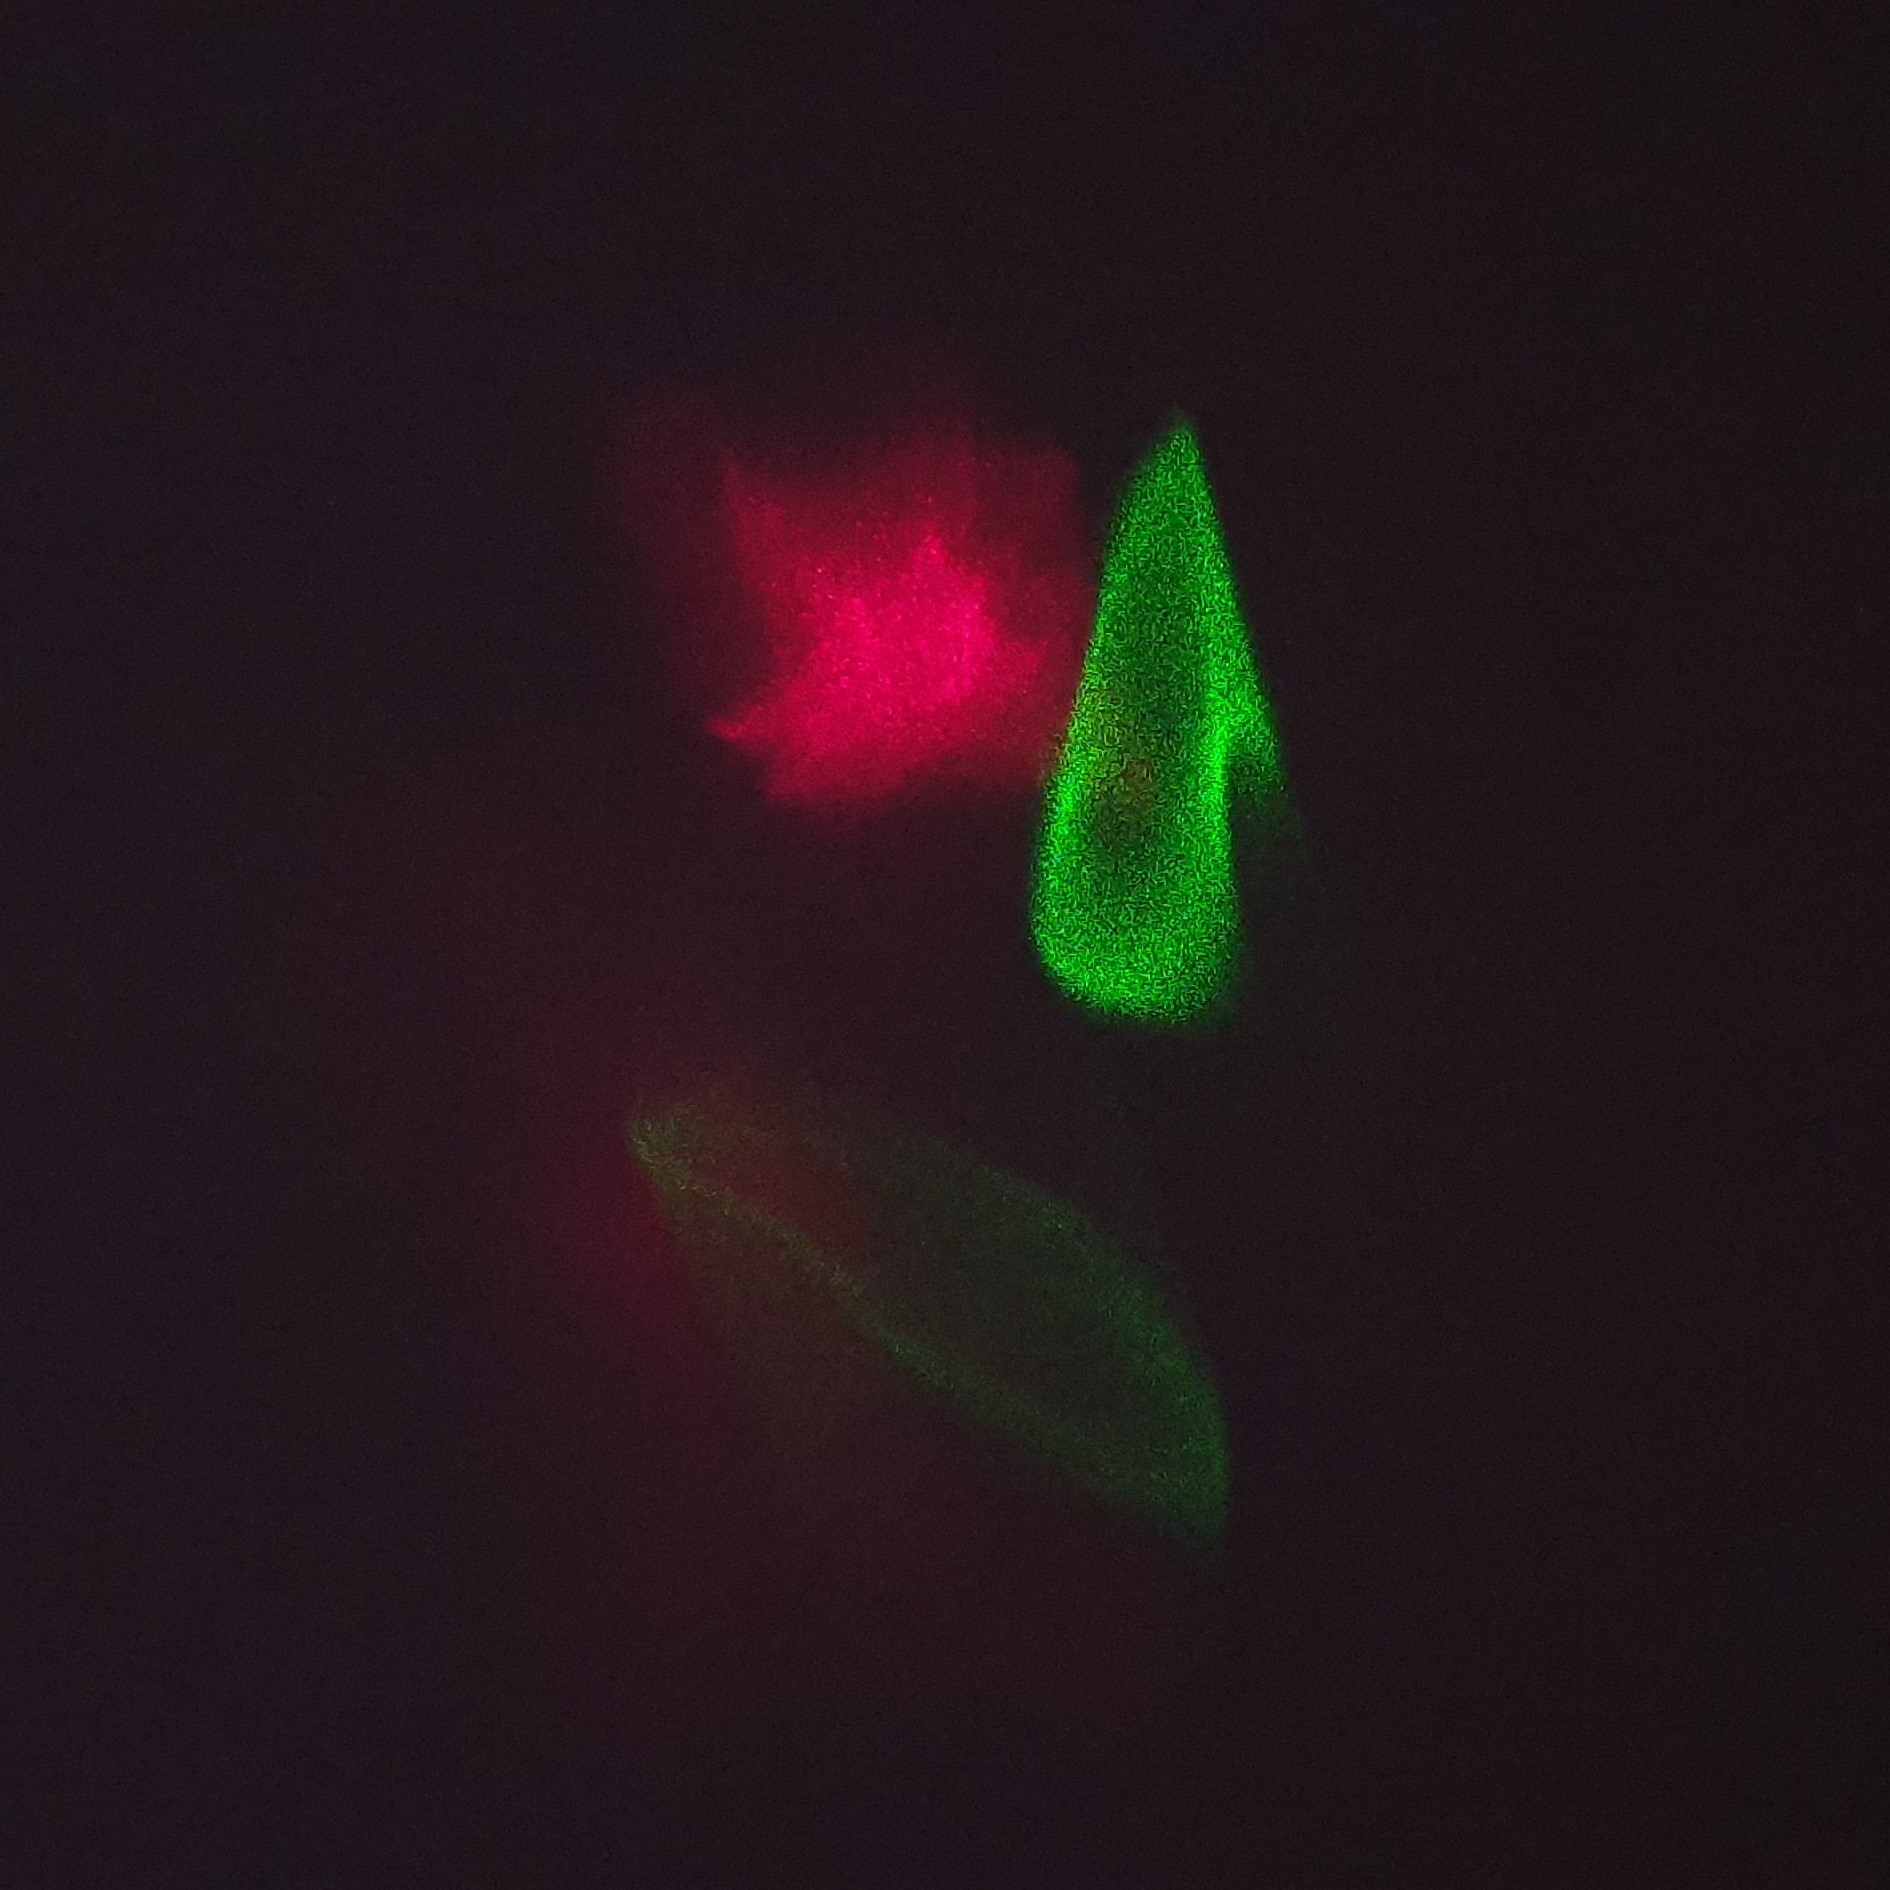 FIg. 93
 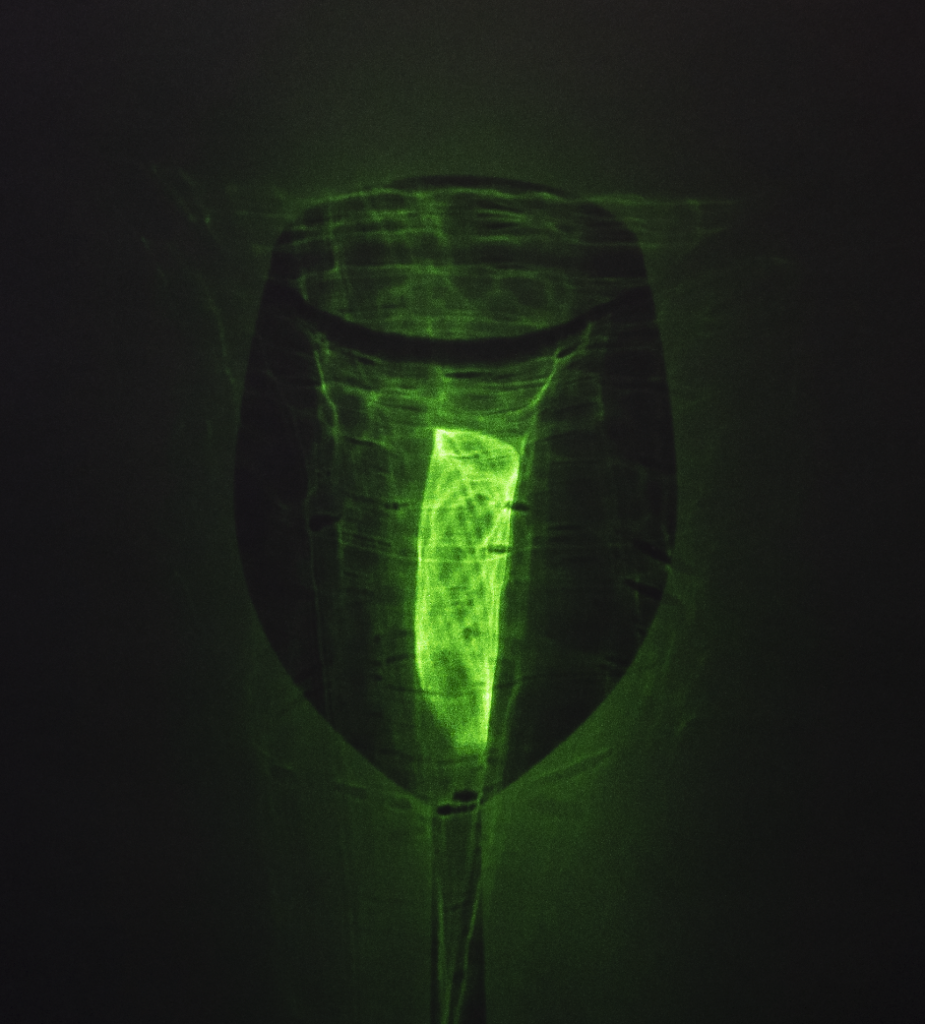 Fig. 94
 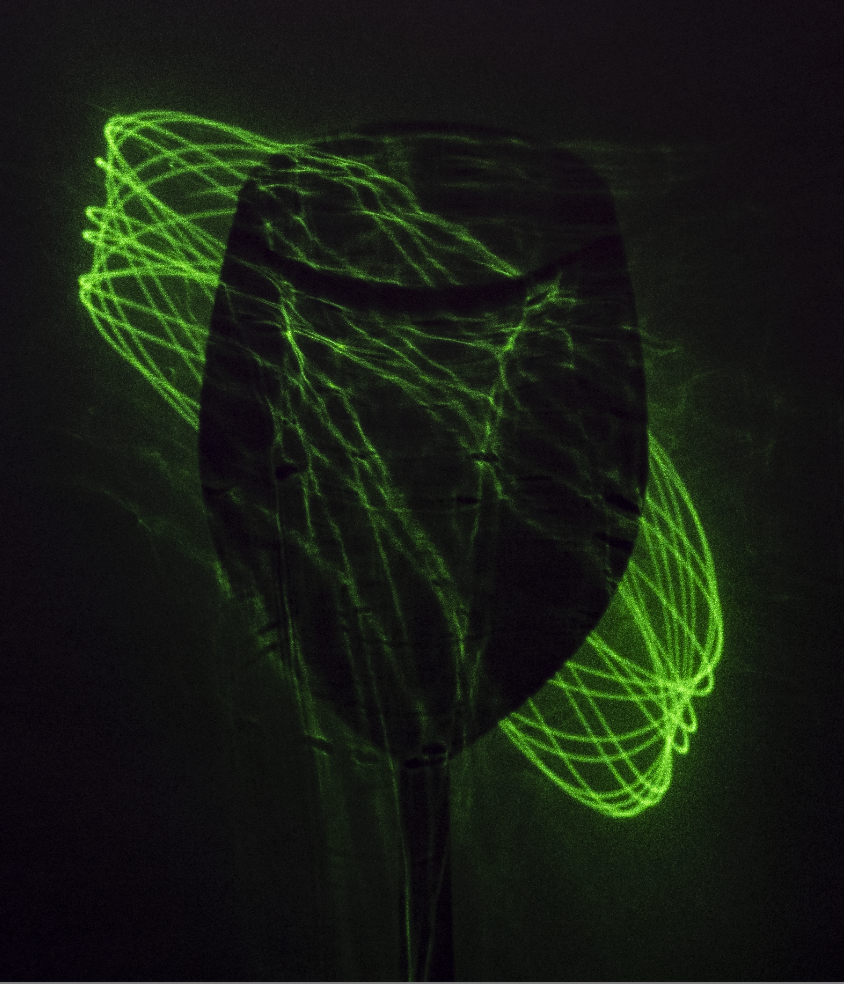 Fig. 95
 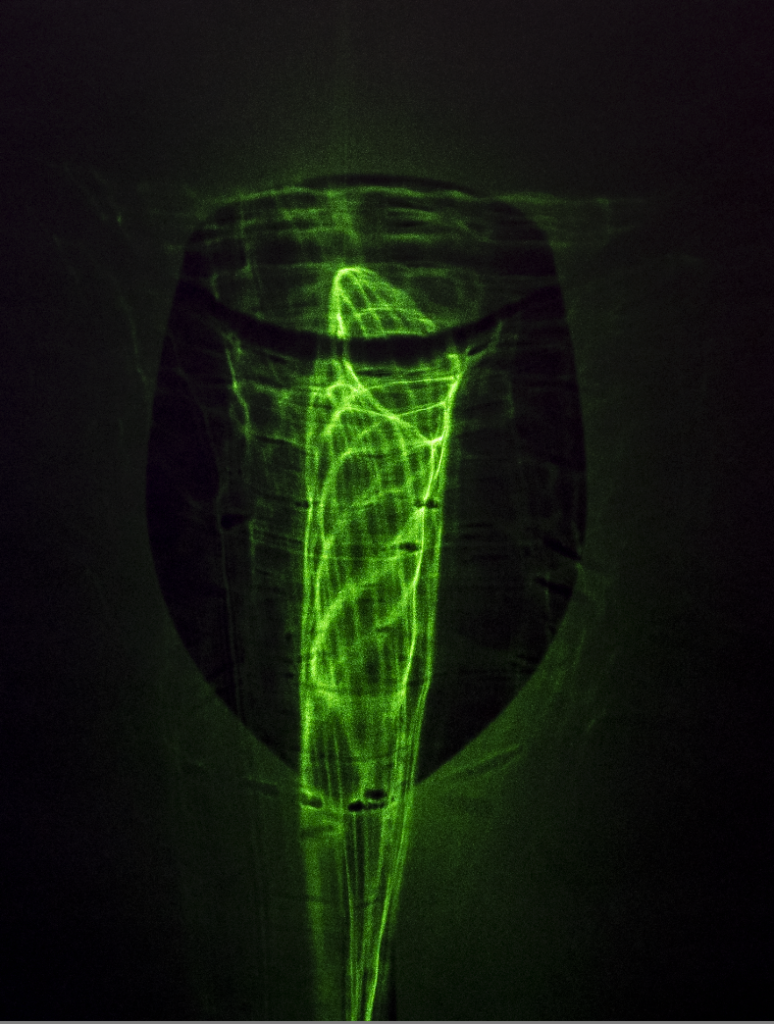 Fig. 96
 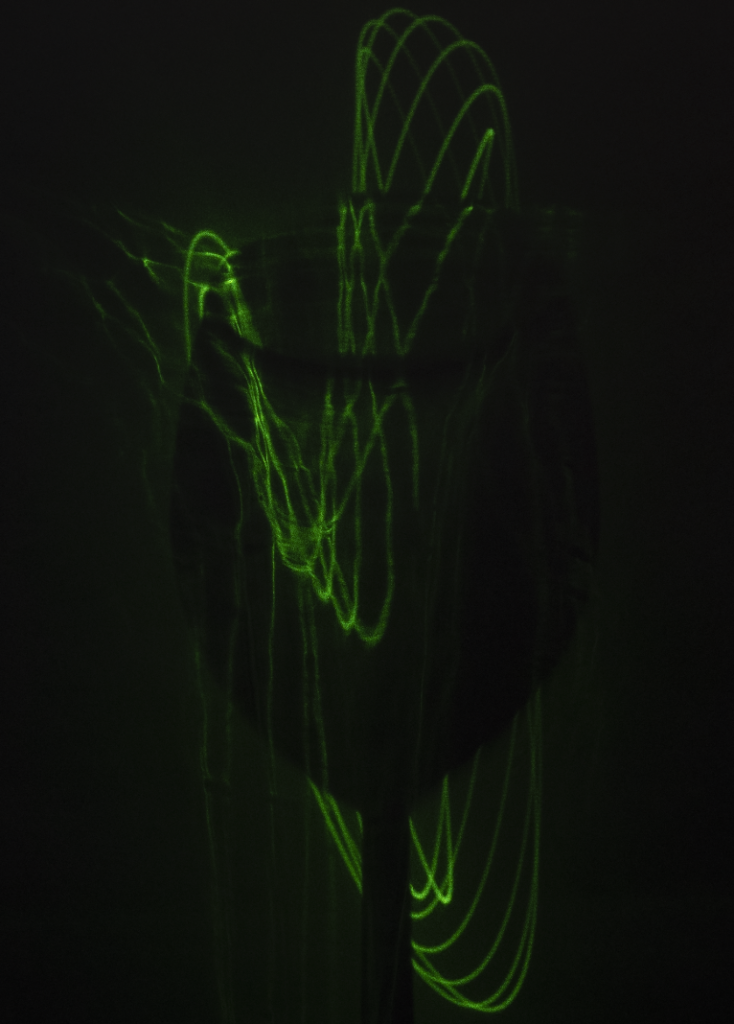 Fig. 97
 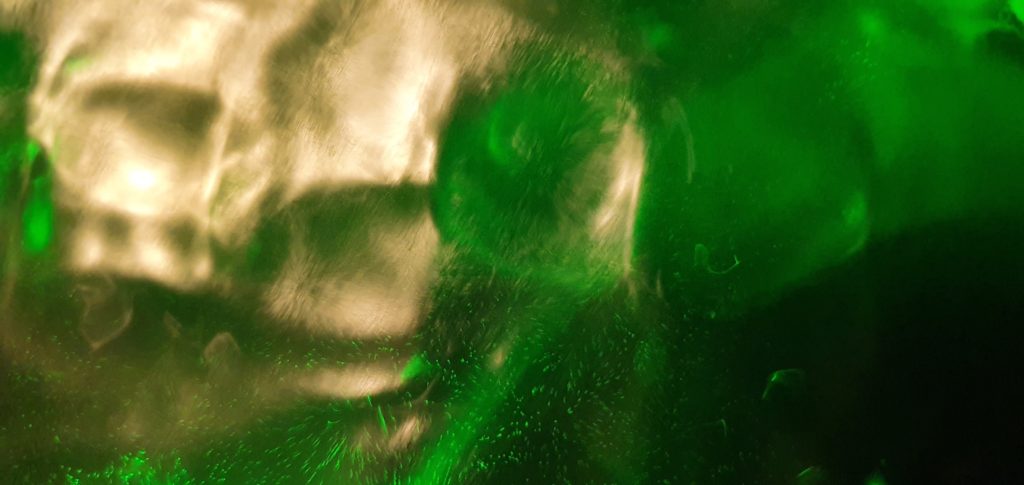 Fig. 98
 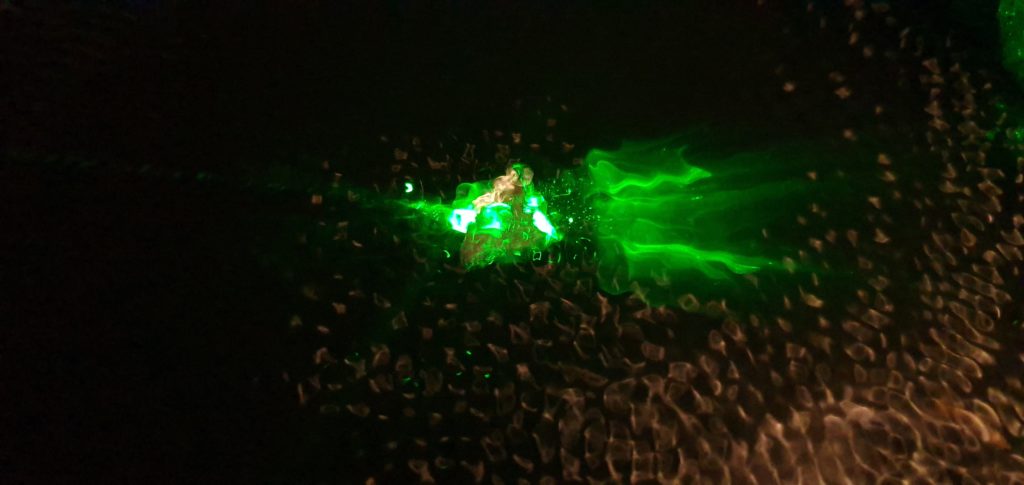 Fig. 99
 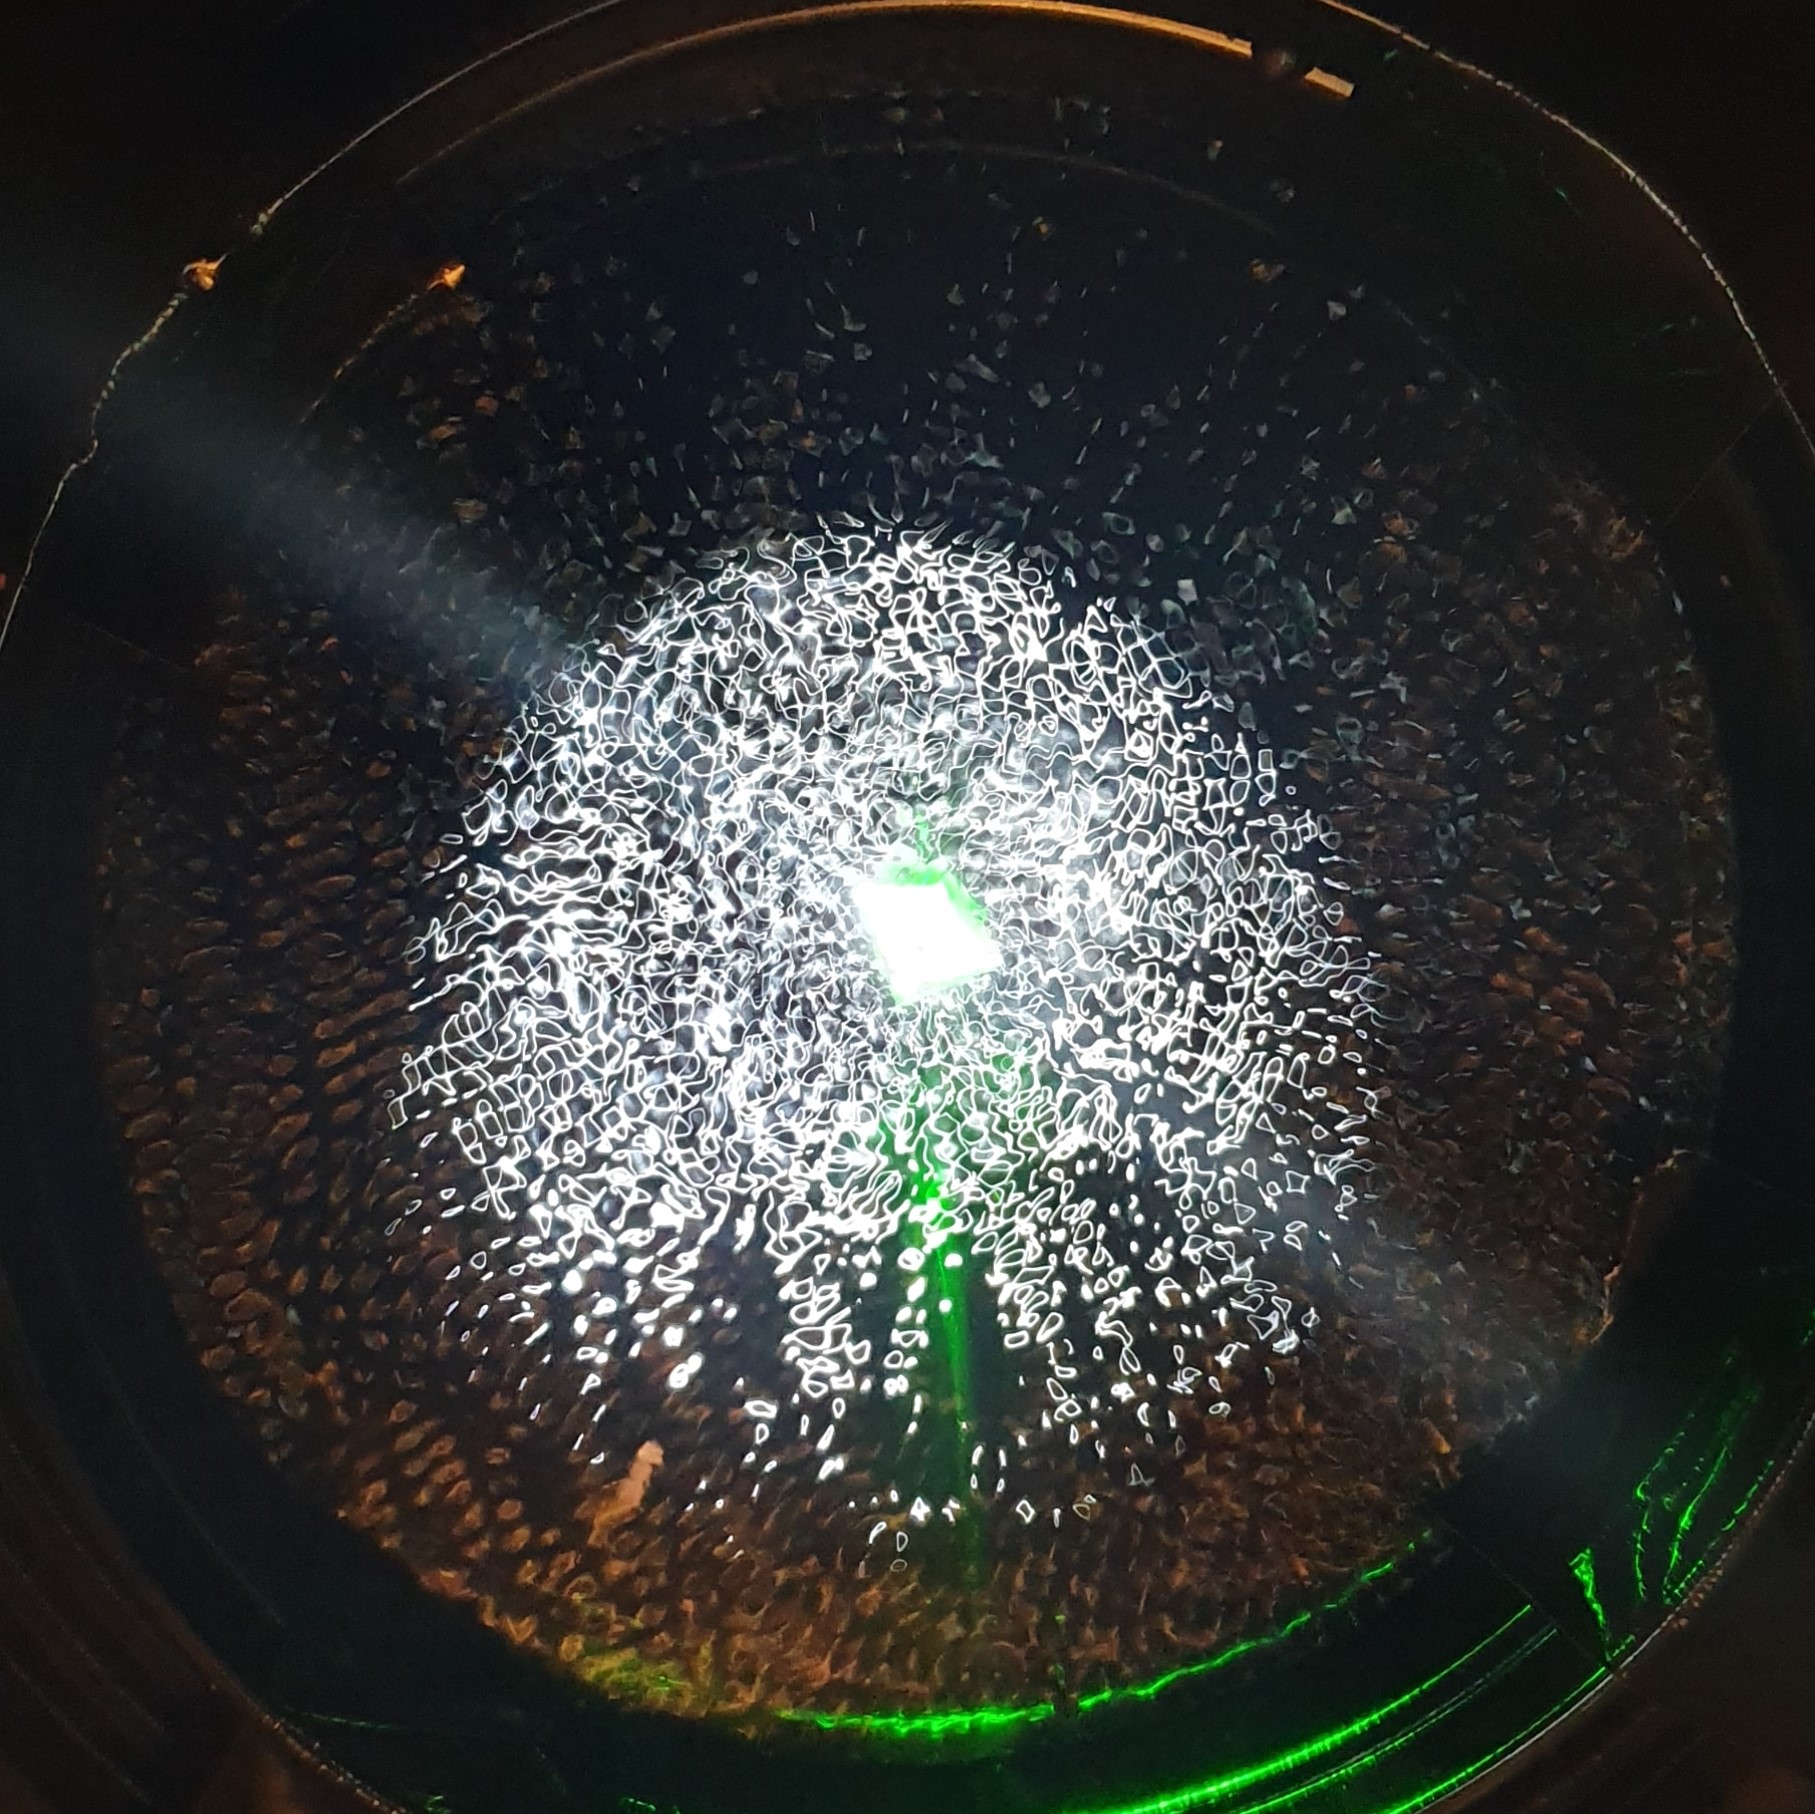 Fig. 100
 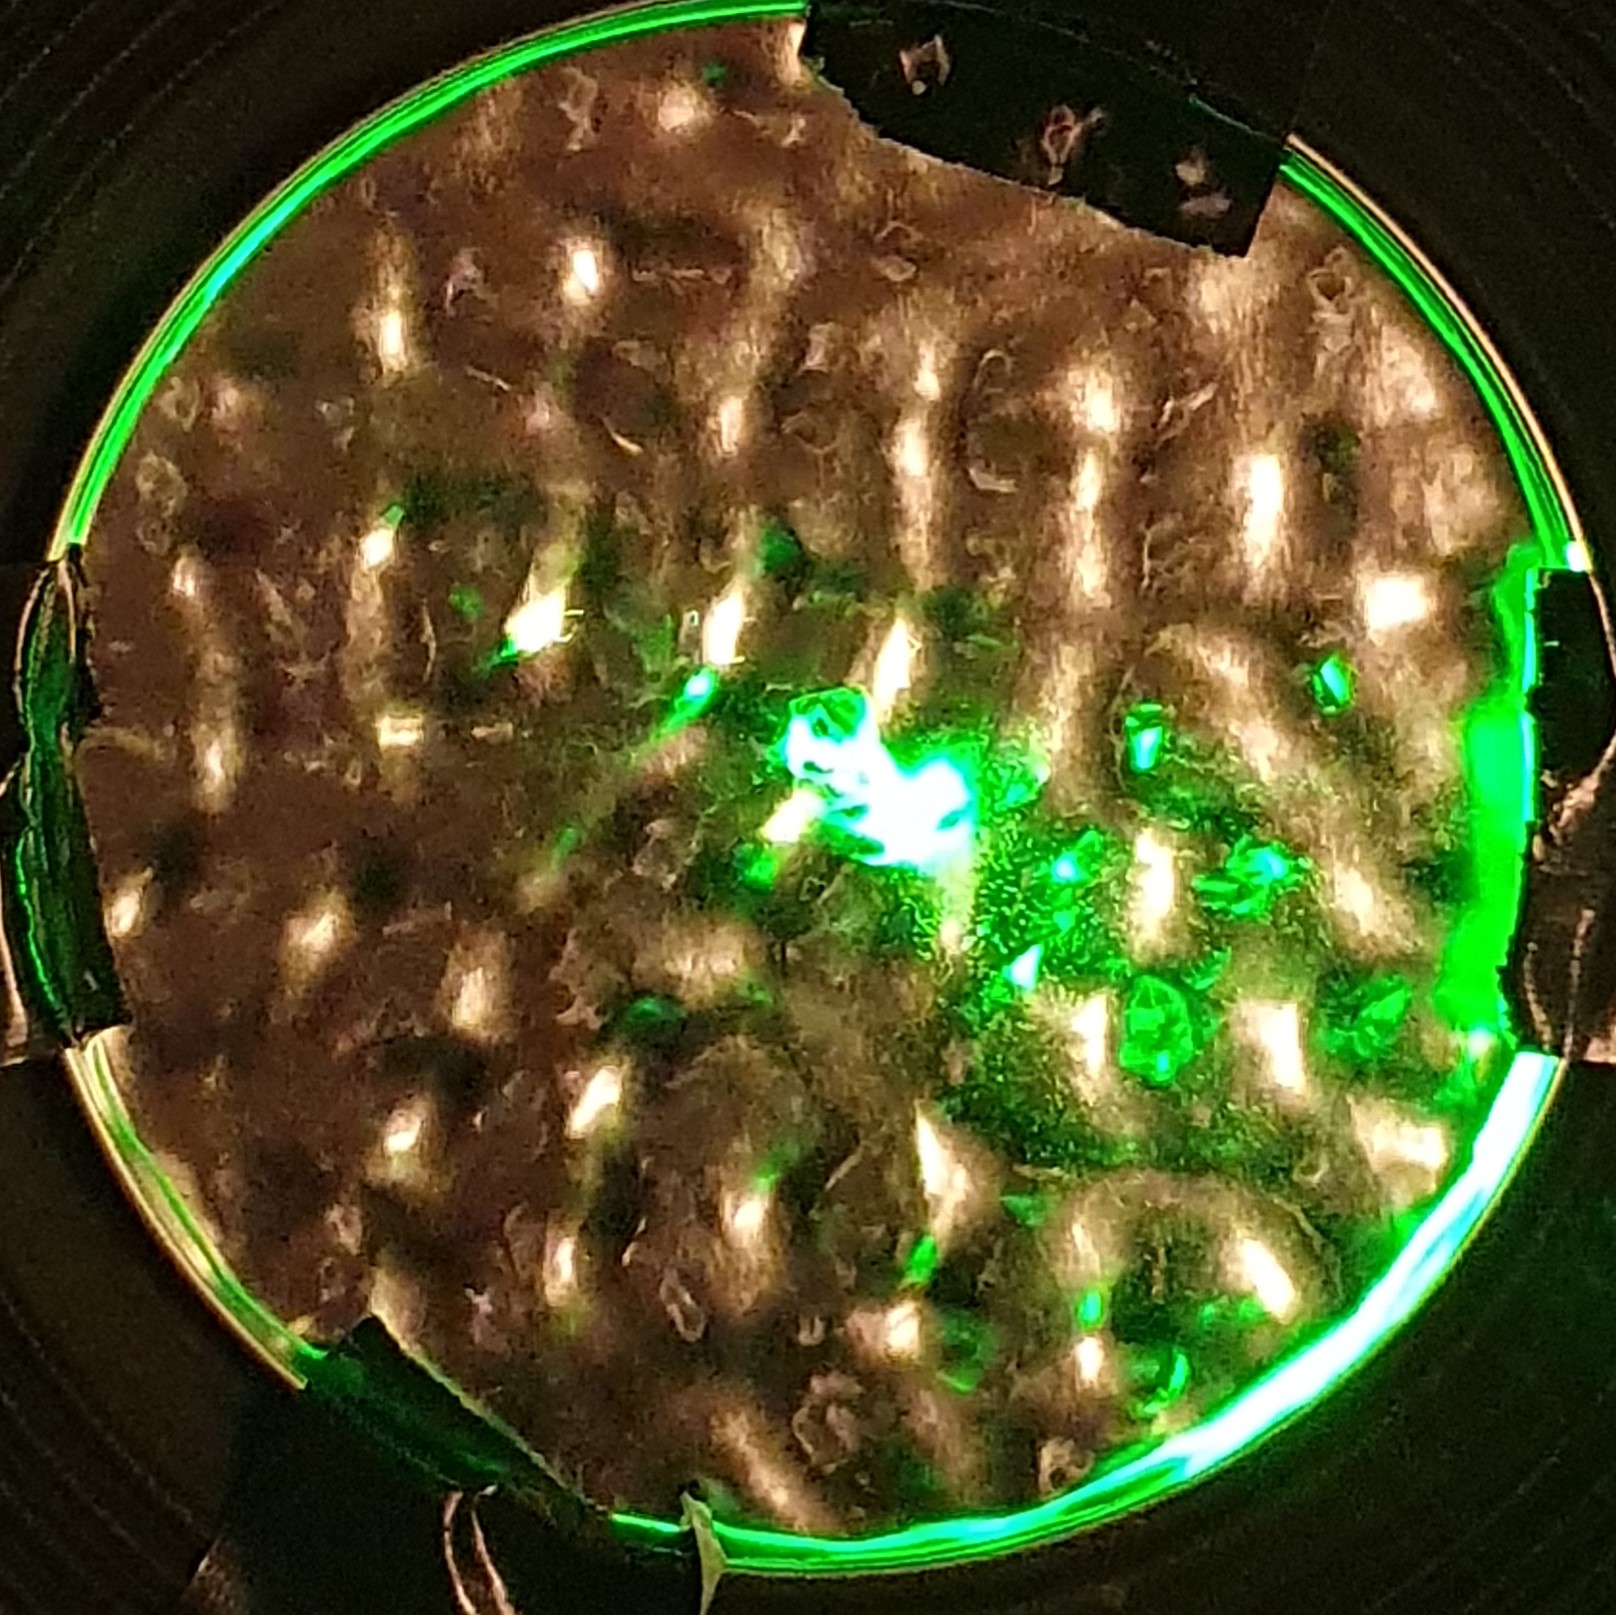 Fig. 101
On the next set of images (fig. 102-105), I tried to use a smoke machine to make the beam of light more visible. By doing this, we can see the movement of the laser while it was reacting to the different frequencies. By observing these images, we can understand how the laser moves in terms of creating the shapes we see.
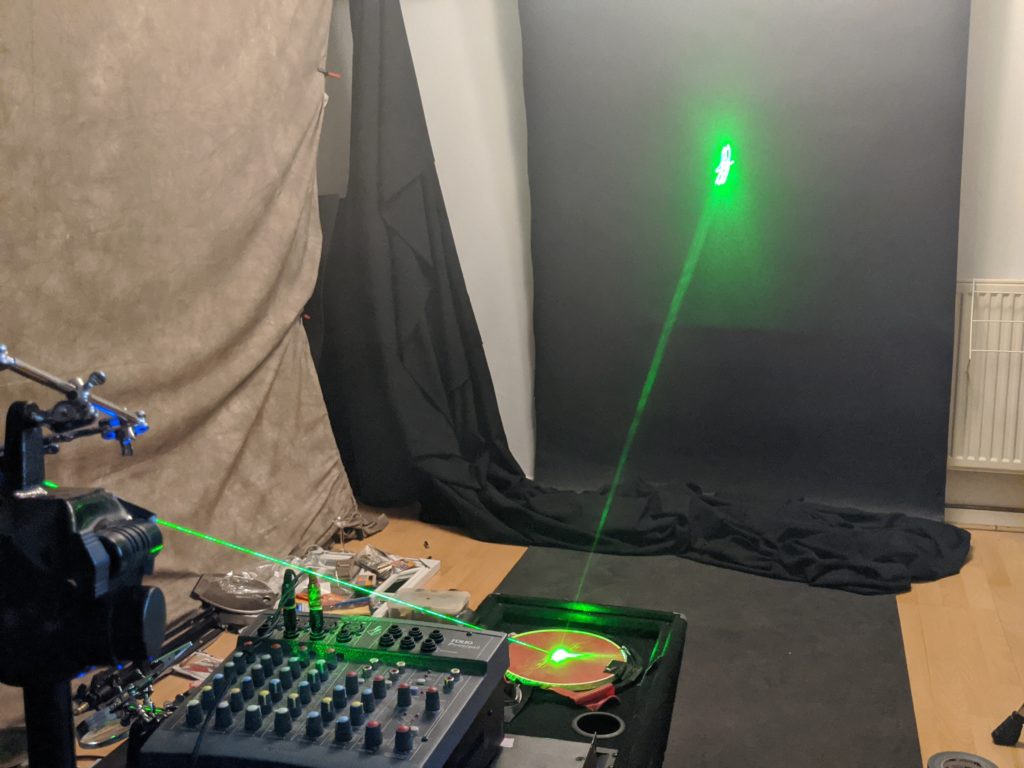 FIg. 102
 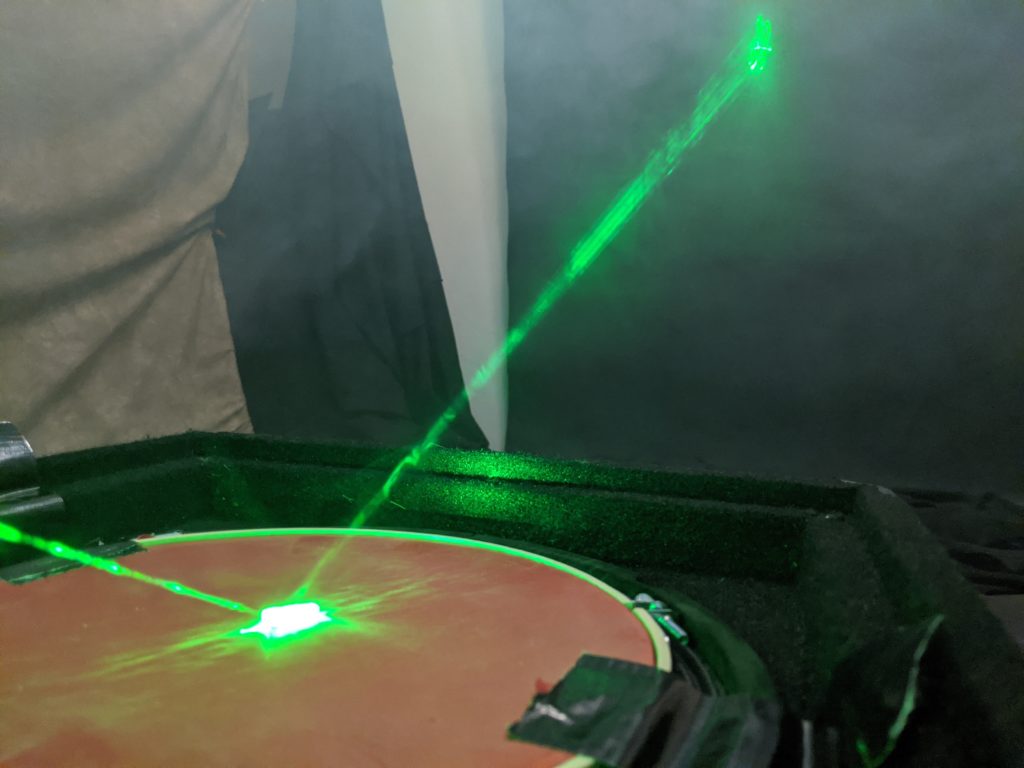 Fig. 103
 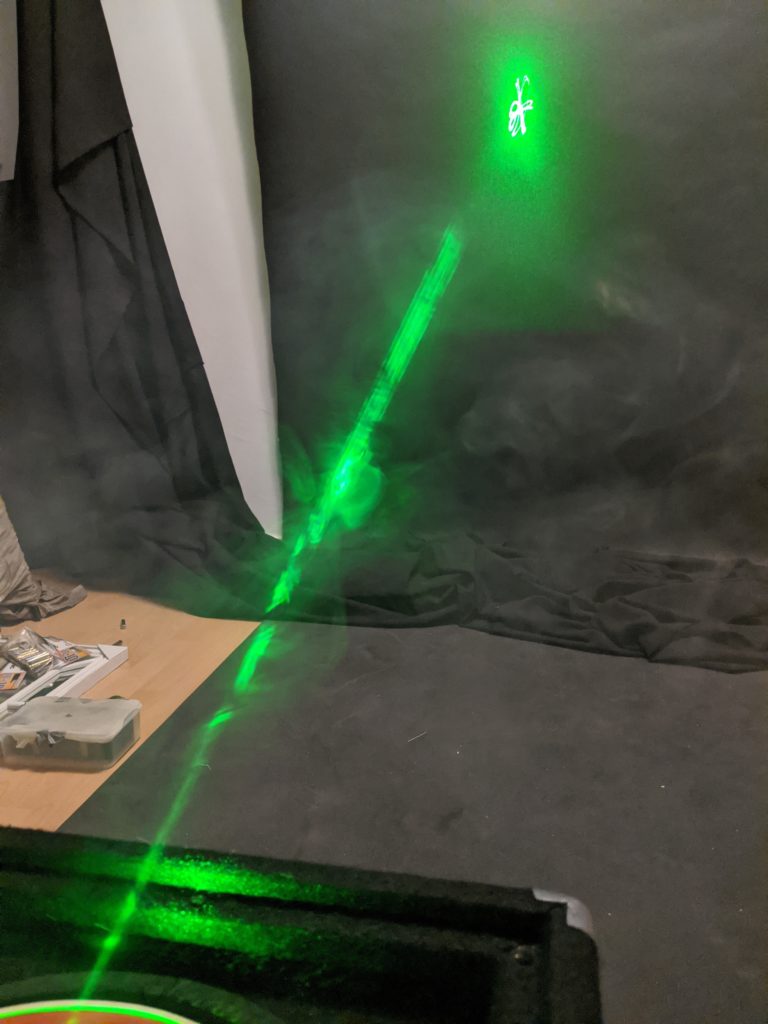 Fig. 104
 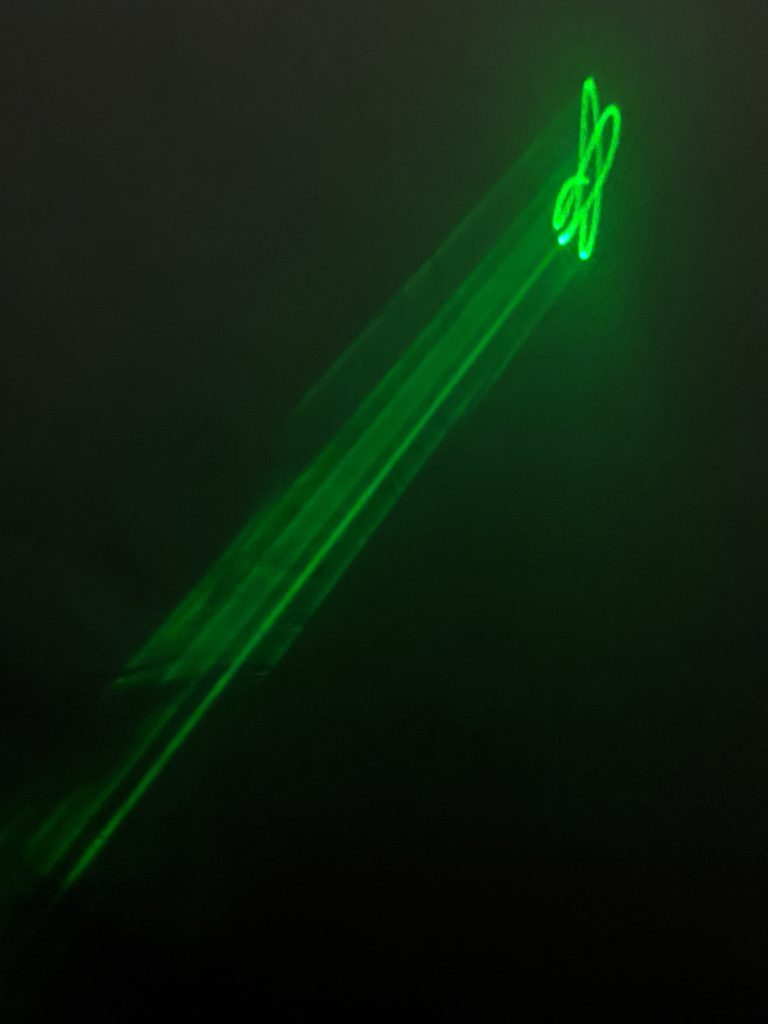 Fig. 105
On the last set of images (fig. 106-116), we can see my set up for this project along with the equipment I used so far.
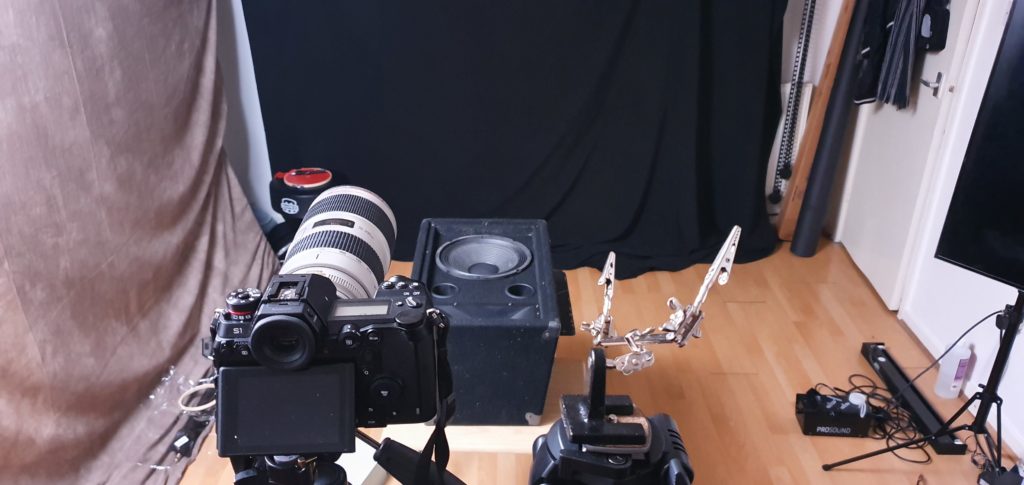 Fig. 106
 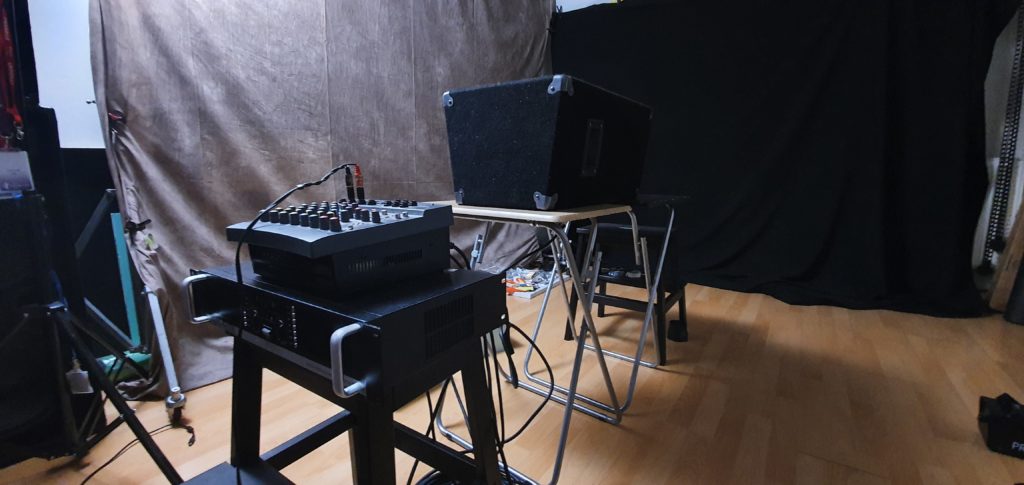 Fig. 107
 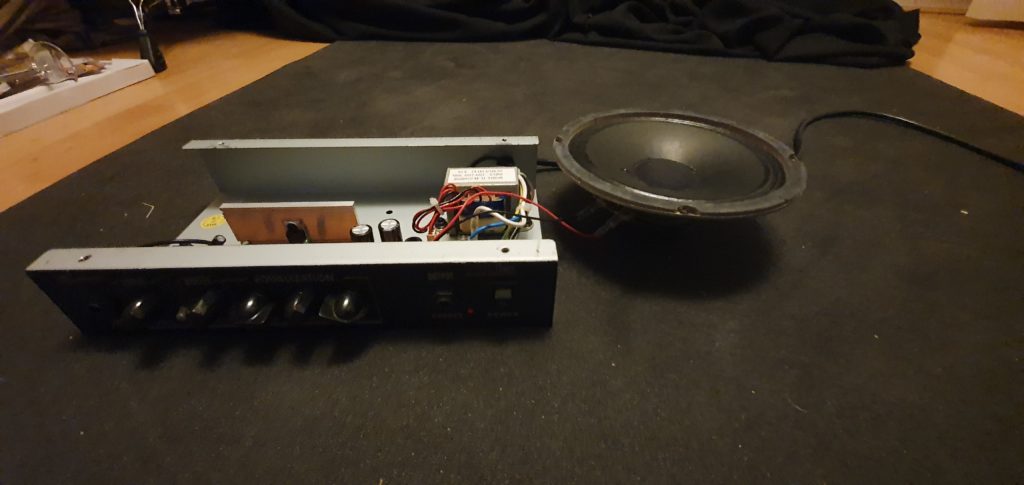 Fig. 108
 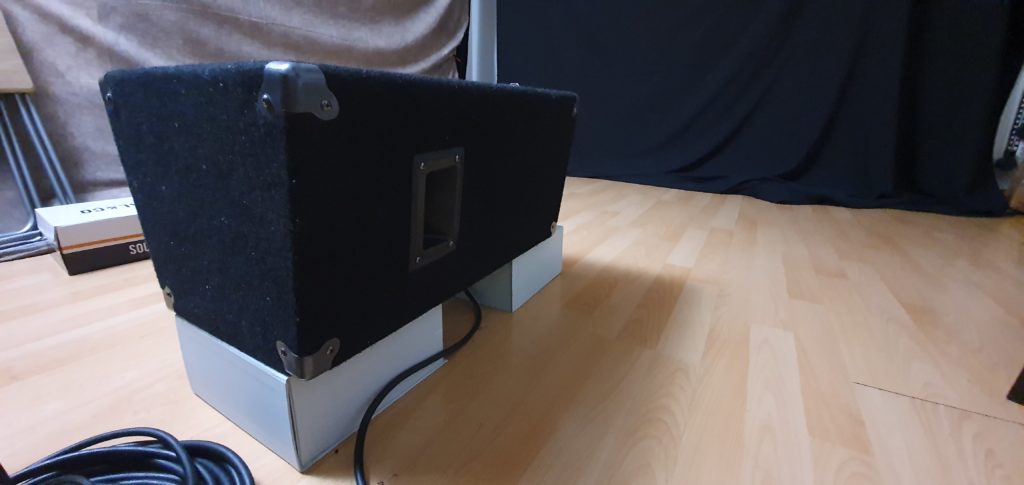 Fig. 109
 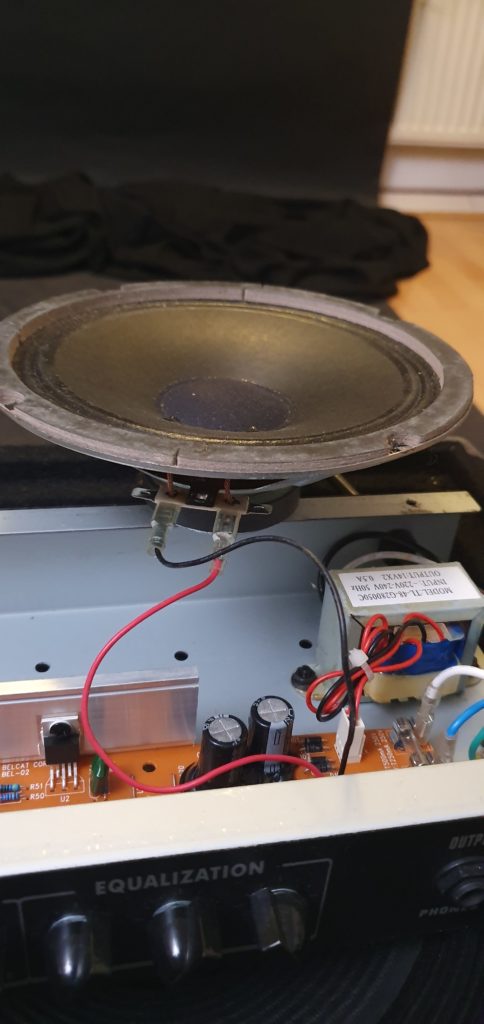 Fig. 110
 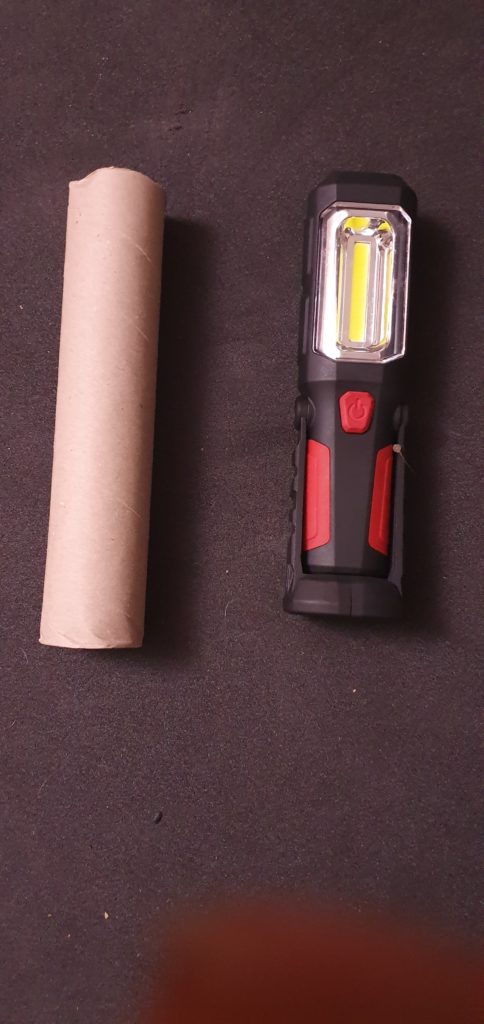 Fig. 111
 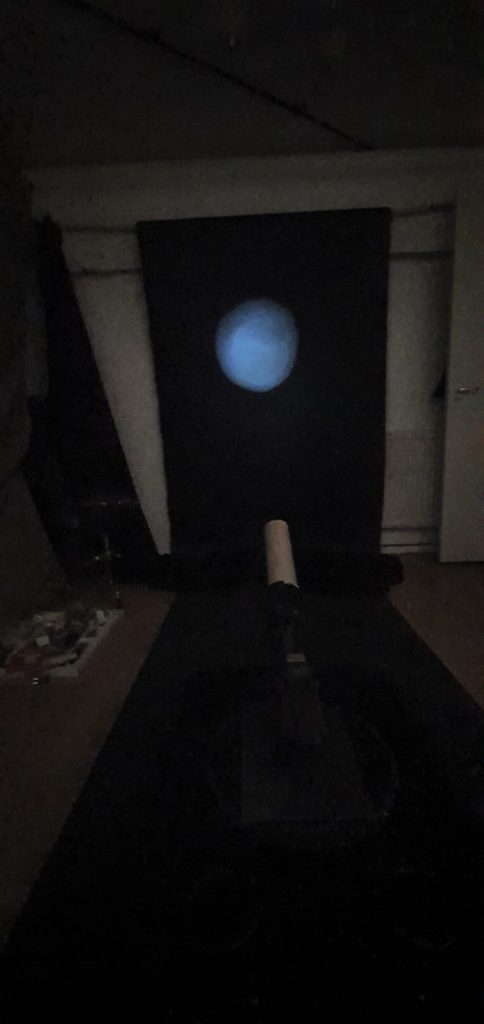 Fig. 112
 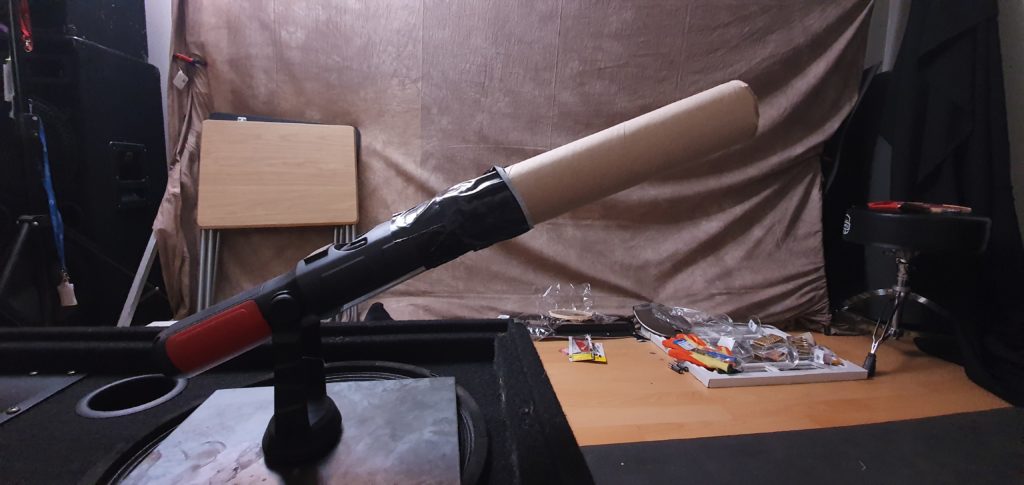 Fig. 113
 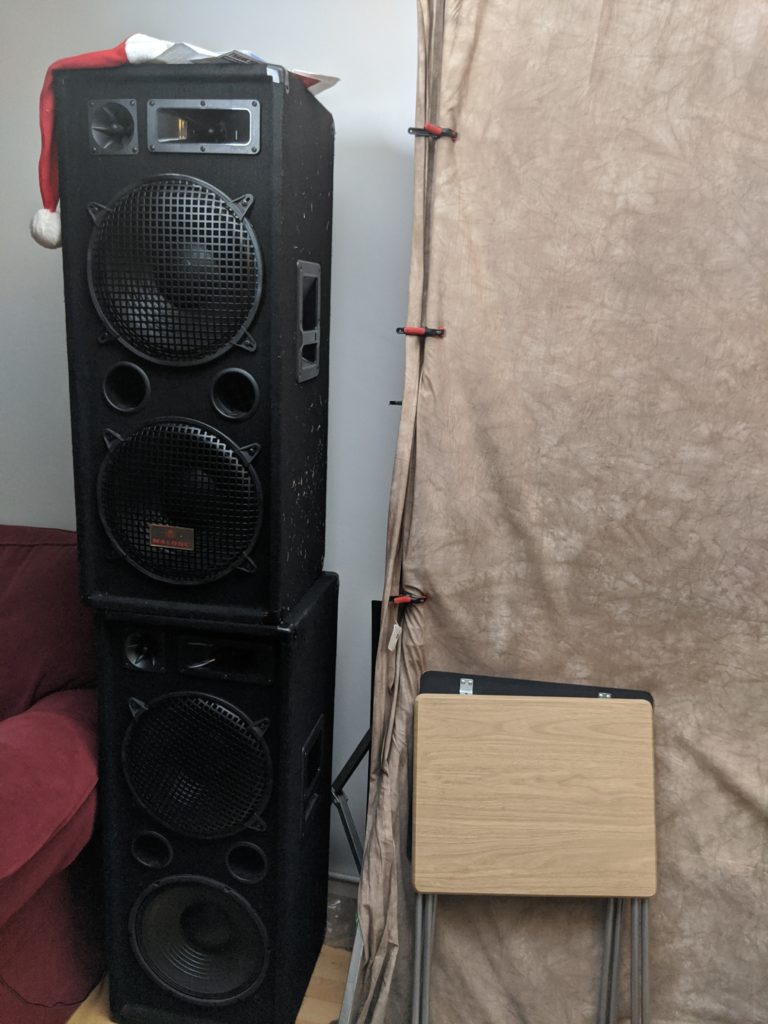 Fig. 114
  Fig. 115
 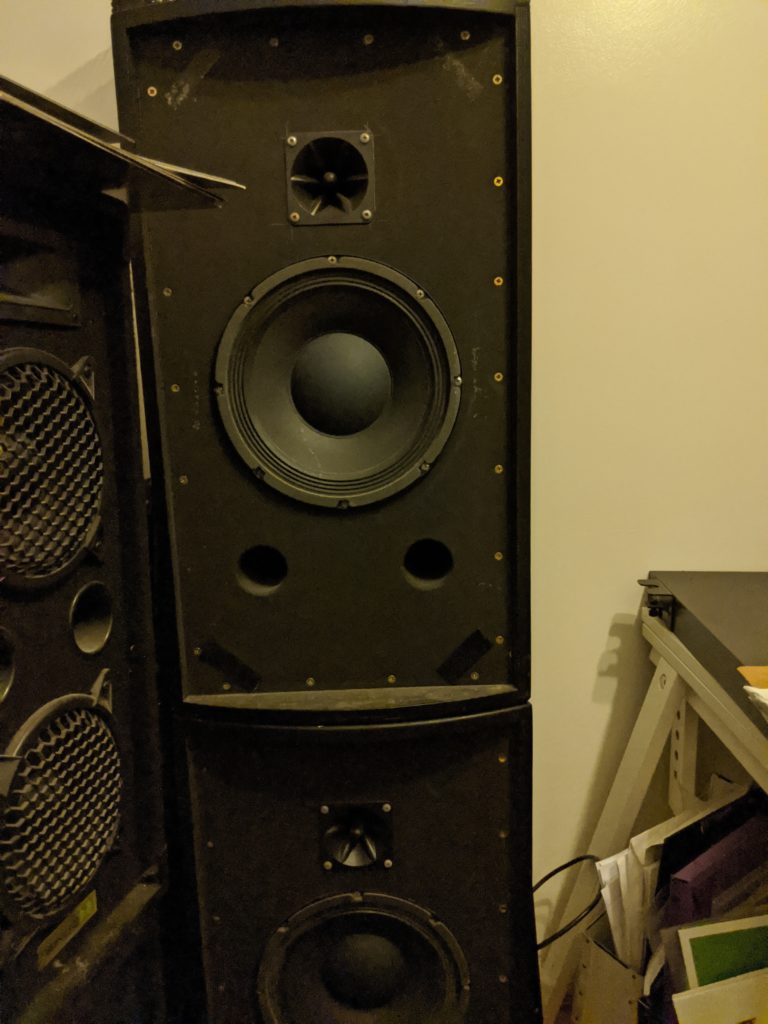 Fig. 115
What is remarkable about this project is that endless tests and combinations can be applied in an ever-experimenting scenario, always producing interesting results, some of which may have never been experienced before by another witness/viewer. In short, it is a journey that is endless.
Fig. 115
What is remarkable about this project is that endless tests and combinations can be applied in an ever-experimenting scenario, always producing interesting results, some of which may have never been experienced before by another witness/viewer. In short, it is a journey that is endless.Before reaching the end of this project for the first semester, I feel it is useful to list what equipment I used to achieve the results seen so far.
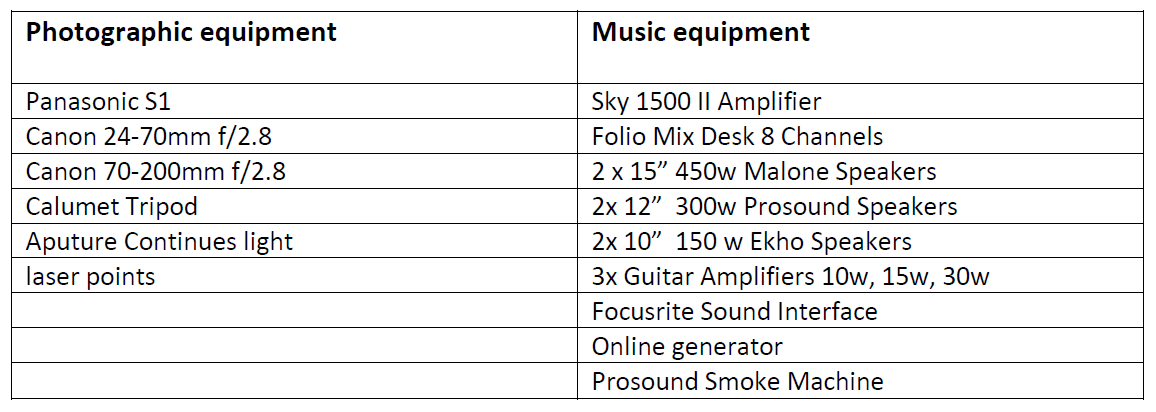 Equipment Used
After finishing the first part of this project and having spent many hours in front of my computer and behind my camera I feel very excited I had the idea for this project. I feel happy because I discovered something that it will keep me going for many years to come. I can not wait to find more information to develop it even more but most importantly I really enjoyed every minute of it and I can’t wait for more trial and error.
The cost for this project was around 1200 pounds.
In conclusion, I would like to add that after hundreds of hours of research and practice on this project I feel that it is just the beginning of an endless trip in photography science and sound world.
References Cited
- Hiroshi Sugimoto, https://www.famousphotographers.net/hiroshi-sugimoto ↑
- Hiroshi Sugimoto, https://m.theartstory.org/artist/sugimoto-hiroshi/ ↑
- Hiroshi Sugimoto, https://m.theartstory.org/artist/sugimoto-hiroshi/ ↑
- Hiroshi Sugimoto, https://www.sugimotohiroshi.com/new-page-7 ↑
- Pink Floyd, https://en.m.wikipedia.org/wiki/Pink_Floyd ↑
- Sounds of Silence, http://www.pink-floyd.org/artint/1.htm ↑
- Interview with David Gilmour by Johnnie Walker, http://www.pink-floyd.org/artint/glmrbbc270902.htm ↑
- Not 5 but 33 senses, https://www.sciculture.ac.uk/2014/06/12/not-5-but-33-senses/ ↑
- Bjork Biophilia, https://www.google.co.uk/amp/s/pitchfork.com/reviews/albums/15915-biophilia/amp/ ↑
- Björk: Biophilia – review, https://www.google.co.uk/amp/s/amp.theguardian.com/music/2011/oct/06/bjork-biophilia-cd-review ↑
- ReacTable Tactile Synth Catches Björk’s Eye – and Ear https://www.wired.com/2007/08/reactable-tactile- synth-catches-bjrks-eye-and-ear/ ↑
- ReacTable Tactile Synth Catches Björk’s Eye – and Ear https://www.wired.com/2007/08/reactable-tactile-synth-catches-bjrks-eye-and-ear/ ↑
- 8 Lessons Ansel Adams Can Teach You About Photography https://erickimphotography.com/blog/ansel-adams/ ↑
- Art News, Ansel Adams – The Last Interview http://www.maryellenmark.com/text/magazines/art%20news/905N-000-001.html ↑
- Art News, Ansel Adams – The Last Interview http://www.maryellenmark.com/text/magazines/art%20news/905N-000-001.html ↑
- What Is Frequency? – Definition, Spectrum & Theory https://study.com/academy/lesson/what-is-frequency-definition-spectrum-theory.html ↑
- Speed of Sound in Various Bulk Media http://hyperphysics.phy-astr.gsu.edu/hbase/Tables/Soundv.html ↑
- Additional Solfeggio Frequencies and Combinations. https://listeningtosmile1.bandcamp.com/album/additional-solfeggio-frequencies-and-combinations ↑
- Sacred Frequencies. https://listeningtosmile.com/sacred-frequencies/ ↑
- Additional Solfeggio Frequencies and Combinations …. https://listeningtosmile1.bandcamp.com/album/additional-solfeggio-frequencies-and-combinations ↑
References List
Andrews, R.(2007) ReacTable Tactile Synth Catches Björk’s Eye and Ear. Wired.
https://www.wired.com/2007/08/reactable-tactile-synth-catches-bjrks-eye-and-ear/ Date Accessed 12/11/19 Basel, A. (2018) Distorted Universal Vision (Self-Portrait), 2003. Art Basel.
https://www.artbasel.com/catalog/artwork/67378/Hiroshi-Sugimoto-Distorted-Universal-Vision-Self-Portrait
Date Accessed 16/10/19 Biography.com Editors ( 2014) Björk Biography. A&E Television Networks
https://www.biography.com/musician/bjork Date Accessed 16/11/19 Boilen, B. (2011) Biophilia: Bjork Visualizes Music. NPR.org.
https://www.npr.org/sections/allsongs/2011/10/11/141216820/biophilia-bjork-visualizes-music Date Accessed 17/11/19
Damaschke, S. (2015) Björk’s music as art. DW.COM. https://www.dw.com/en/bj%C3%B6rks-music-as-art/a-18303597 Date Accessed 20/11/19
Dorothy, (2014) Not 5 but 33 senses. Science in Culture.https://www.sciculture.ac.uk/2014/06/12/not-5-but-33-senses/ Date Accessed 28/10/19 Electrical, (2018) What is Frequency and How To Measure Frequency. Electrical4u.
https://www.electrical4u.net/electrical-basic/frequency-measure-frequency/
Date Accessed 30/10/19 ERIC KIM (2014) 17 Lessons Henri Cartier-Bresson Has Taught Me About Street Photography, ERIC KIM.
URL https://erickimphotography.com/blog/2014/12/09/17-lessons-henri-cartier-bresson-
taught-street-photography/
Date Accessed 01/11/19 ERIC KIM (2016) 8 Lessons Ansel Adams Can Teach You About Photography. ERIC KIM. URL
https://erickimphotography.com/blog/ansel-adams/
Date Accessed 02/11/19 Fagan, K., (2016) How fast does sound travel?. Discovery of Sound in the Sea. URL
https://dosits.org/science/movement/how-fast-does-sound-travel/
Date Accessed 23/11/19 Famous Photographers (2018) Editors, Hiroshi Sugimoto – Photography and Biography. Famous Photographers URL https://www.famousphotographers.net/hiroshi-sugimoto
Date Accessed 28/11/19 France Dias, S. ( 2018) Hiroshi Sugimoto Artist Overview and Analysis. The Art Story. URL
https://www.theartstory.org/artist/sugimoto-hiroshi/ Date Accessed 19/11/19
Harvest Records, (1971) Pink Floyd – Meddle. [Vinyl] URL Date Accessed 19/11/19
Hough, A. (2013) Storm Thorgerson: Pink Floyd album cover designer dies. The Telegraph URL https://www.telegraph.co.uk/culture/music/music-news/10004872/Storm-Thorgerson-Pink-Floyd-album-cover-designer-dies.htmlDate Accessed 20/11/19 How fast does sound travel through water?. BBC Science Focus Magazine. URL
https://www.sciencefocus.com/science/how-fast-does-sound-travel-through-water/
Date Accessed 15/12/19 Jacoby, M. The light was brighter. Spare Bricks – Pink Floyd Webzine, URL
http://sparebricks.fika.org/sbzine15/features2.html
Date Accessed 24/12/19 Kachejian, B. (2015) Top 10 Pink Floyd Album Covers. ClassicRockHistory.com. URL
https://www.classicrockhistory.com/top-10-pink-floyd-album-covers/
Date Accessed 26/12/19 Listening To Smile (2018) Additional Solfeggio Frequencies and Combinations. Listening To Smile. https://listeningtosmile1.bandcamp.com/album/additional-solfeggio-frequencies-and-combinations
Date Accessed 28/11/19 Listening to smile Editors ( 2011) Sacred Frequencies. Listening To Smile. URL
https://listeningtosmile.com/sacred-frequencies/
Date Accessed 30/11/19
Meara, O. (2013) Bjork : Biophilia. Meara O’Reilly URL https://mearaoreilly.com/Bjork-Biophilia Date Accessed 02/12/19
Milton, E. (1984) Ansel Adam – The last interview. Art news pp 76 905N-000-001 URLhttp://www.maryellenmark.com/text/magazines/art%20news/905N-000-001.html Date Accessed 18/11/19 Petridis, A. (2011) Björk: Biophilia – review. The Guardian.
https://www.theguardian.com/music/2011/oct/06/bjork-biophilia-cd-review
Date Accessed 03/11/19 Pytlik, M. (2011) Björk: Biophilia. Pitchfork. URL https://pitchfork.com/reviews/albums/15915-
biophilia/ Date Accessed 03/11/19 Radford, C. (2013) When Bjork Met Attenborough, Channel 4, review. The Telegraph
https://www.telegraph.co.uk/culture/tvandradio/10205345/When-Bjork-Met-Attenborough-
Channel-4-review.html Date Accessed 04/12/19 Rowsell, M (2012) dark side of the moon (iconic album cover #8). Simply Marvellous Music. URL http://simplymarvellousmusic.com/iconic-album-cover-8-dark-side-of-the-moon/
Date Accessed 19/11/19 Sound and Noise – What is sound and What is noise? Environmental Protection Department-The Government of the Hong Kong URL
https://www.epd.gov.hk/epd/noise_education/web/ENG_EPD_HTML/m1/intro_1.html
Date Accessed 21/12/19
Speed of Sound. Hyperphysics.phy-astr.gsu.edu. URL http://hyperphysics.phy-astr.gsu.edu/hbase/Tables/Soundv.html Date Accessed 22/12/19
Sugimoto, H (2004) Colors of Shadow. Hiroshi Sugimoto. URLhttps://www.sugimotohiroshi.com/colors-of-shadow Date Accessed 13/11/19 Sugimoto, H, (1980 – 1996) Seascapes. Hiroshi Sugimoto. URL
https://www.sugimotohiroshi.com/seascapes-1 Date Accessed 14/11/19 Sugimoto, H. (1978-1993) Theaters. Hiroshi Sugimoto URL https://www.sugimotohiroshi.com/new-page-7
Date Accessed 16/11/19 The Elliot Tayman Collection Pink Floyd – A Fleeting Glimpse. URL
https://www.pinkfloydz.com/orphans-part-1/elliot-tayman-collection/
Date Accessed 20/11/19 The Meaning of Pink Floyd’s Dark Side of the Moon. Spinditty. URL
https://spinditty.com/genres/The-Meaning-of-Pink-Floyds-Dark-Side-of-the-Moon
Date Accessed 24/11/19 Thorn, T. (2015) When Björk Met Attenborough. The Critical Rye. URL
https://thecriticaleye.me/2015/03/22/when-bjork-met-attenborough/
Date Accessed 21/12/19 Tolinski, B. (2008) Pink Floyd: Sounds of Silence.GuitarWorld. URL
https://www.guitarworld.com/features/pink-floyd-sounds-silence Date Accessed 28/12/19
Tolinski, B. Sounds of Silence. Pink Floyd Org URL http://www.pink-floyd.org/artint/1.htm Date Accessed 29/12/19
Universal Music, (2011) Bjork – Biophilia (2 Lp).[Vynil] Polydor URLhttps://www.merchandisingplaza.us/Bjoerk/Vynil-Bjork—Biophilia–2-Lp–204080
Date Accessed 29/12/19
Walker, J. ( 2002) Interview with David Gilmour. BBC Radio 2 URL http://www.pink-floyd.org/artint/glmrbbc270902.htm Date Accessed 27/12/19
Wilson, S. (2017) 7 times Björk used cutting-edge technology to shape her music. FACT Magazine: Transmissions from the underground. URL https://www.factmag.com/2017/11/24/bjork-technology-instruments-software/Date Accessed 28/12/19 Wood, D. What Is Frequency? – Definition, Spectrum & Theory – Video & Lesson Transcript | Study.com URL https://study.com/academy/lesson/what-is-frequency-definition-spectrum-
theory.html Date Accessed 23/12/19
Illustrations List
Fig. 1: Sugimoto, H., (2003), Distorted Universal Vision (Self-Portrait), [Gelatin-Silver print] Available from https://www.artbasel.com/catalog/artwork/67378/Hiroshi-Sugimoto-Distorted-Universal-Vision-Self-Portrait, Last Accessed: 01.10.2019
Fig. 2: Sugimoto, H., (1980), Caribbean Sea, Jamaica, [Photograph] Available from https://www.sugimotohiroshi.com/seascapes-1, Last Accessed: 01.10.2019
Fig. 3: Sugimoto, H., (1982), Ligurian Sea, Saviore,[Photograph] Available from https://www.sugimotohiroshi.com/seascapes-1, Last Accessed: 01.10.2019
Fig. 4: Sugimoto, H., (1996), Baltic Sea, Rügen,[Photograph] Available from https://www.sugimotohiroshi.com/seascapes-1, Last Accessed: 01.10.2019
Fig. 5: Sugimoto, H., (2004), Color of Shadows, 1015, [Photograph] Available from https://www.sugimotohiroshi.com/colors-of-shadow, Last Accessed: 03.10.2019
Fig. 6: Sugimoto, H., (1993), Carpenter Center, [Photograph] Available from https://www.sugimotohiroshi.com/new-page-7, Last Accessed: 05.10.2019
Fig. 7: Sugimoto, H., (1978), U. A. Play House, [Photograph] Available from https://www.sugimotohiroshi.com/new-page-7, Last Accessed: 05.10.2019
Fig. 8: Walter, C., (1967), Pink Floyd with Syd Barrett in London, [Photograph – From Original Negative] Available from https://fineartamerica.com/featured/2-pink-floyd-1967-chris-walter.html, Last Accessed: 9.10.2019
Fig. 9: (1994), Pink Floyd – A Division Bell tour stop Available from http://sparebricks.fika.org/sbzine15/features2.html, Last Accessed: 12.10.2019
Fig. 10: (1977), Pink Floyd at Madison Square Garden Available from http://sparebricks.fika.org/sbzine15/features2.html, Last Accessed: 12.10.2019
Fig. 11: Thorgerson, S. & Hipgnosis design group,(1973), Pink Floyd-“the dark side of the moon”, [Album’s Photo] Available from http://simplymarvellousmusic.com/iconic-album-cover-8-dark-side-of-the-moon/, Last Accessed: 14.10.2019
Fig. 12: Thorgerson, S.(1971), Pink Floyd- Meddle”, [Album’s Photo], Available from https://www.londondrugs.com/pink-floyd—meddle-2016—vinyl/L9367178.html, Last Accessed: 14.10.2019
Fig. 13: Inez and Vinoodh/One Little Indian, (2011), Bjork- “Biophilia”, [Album’s Photo] Available from https://www.merchandisingplaza.us/Bjoerk/Vynil-Bjork—Biophilia–2-Lp–204080
Fig. 14: When Bjork Met Attenborough, (2013), When Bjork Met Attenborough, Directed by Luise Hooper, [Film still], England, Pulse Films – One little Indian Records, Available from https://www.telegraph.co.uk/culture/tvandradio/10205345/When-Bjork-Met-Attenborough-Channel-4-review.html
Fig. 15: When Bjork Met Attenborough, (2013), When Bjork Met Attenborough, Directed by Luise Hooper, [Film still], England, Pulse Films – One little Indian Records, Available from https://thecriticaleye.me/2015/03/22/when-bjork-met-attenborough/
Fig. 16: Chladni Plate, Available from http://sparebricks.fika.org/sbzine15/features2.html, https://www.arborsci.com/products/chladni-plates-kit, Last Accessed: 20.10.2019
Fig. 17: Crystalline,(2011) Bjork-Crystalline, Directed by Michel Gondry, [Film still], England, Partizan, Available from https://www.youtube.com/watch?v=2PNzytx9EV0&fbclid=IwAR0_RNPhQ51LYUTI5FyTO6oH7QrZCjN0vV3jhYzmwTgCkI8reWLjucfdLNA, Last Accessed: 12.12.2019
Fig. 18: Reactable, Available from https://equipboard.com/items/reactable-live-s5 Last Accessed: 22.10.2019
Fig. 19: Reactable, Available from https://www.researchgate.net/figure/Presentation-du-demonstrateur-musical-de-la-ReacTable_fig5_280899611, Last Accessed: 22.10.2019
Fig. 20: Chalkis by night, Greece Available from http://www.gazzetta.gr/weekend-journal/article/1347434/halkida-oraiotero-proastio-tis-athinas, Last Accessed: 25.10.2019
Fig. 21: Baimpakis C. (1997), Live in Athens, (Christos Baimpakis’ own private collection)
Fig. 22: Baimpakis C. (2019), An image from work,(Christos Baimpakis’ own private collection)
Fig. 23: Malcolm Greany J., (1950), A portrait of photographer Ansel Adams [Photograph] Available from https://www.wikiart.org/en/ansel-adams, Last Accessed: 28.10.2019
Fig. 24: Reactable, Available from https://www.researchgate.net/figure/Presentation-du-demonstrateur-musical-de-la-ReacTable_fig5_280899611, Last Accessed: 29.10.2019
Fig. 25: Cartier-Bresson H.,(1932), The Var department. Hyeres, France, [gelatin silver print], Available from https://www.magnumphotos.com/theory-and-practice/henri-cartier-bresson-principles-practice/?fbclid=IwAR3rQe1K6SzidVTjGE_40yUlIOFu-ryVSrnHHP8gOQxVxJq17nFS5IEMRgg, Last Accessed: 29.10.2019
Fig. 26: Cartier-Bresson H.,(1932), Place de l’ Europe. Gare Saint Lazare.Paris,France, [Photograph], Available from https://www.magnumphotos.com/arts-culture/art/the-minds-eye/?fbclid=IwAR1oExJAWuYRAQQ1h62Q_UnNIPyfNRhMaiO8Kpw-57_f1kMuBPXqC8KJjpk, Last Accessed: 30.10.2019
Fig. 27: Cartier-Bresson H.,(1969), PARIS—Brasserie Lipp on St.-Germain-des-Prés. [Photograph]Available fromhttps://www.photographytalk.com/photography-articles/3223-in-depth-composition-the-golden-ratio-vs-the-rule-of thirds?fbclid=IwAR3FrYhlDd9mQE4bwWL7vm8OjiaKhjjSkf8kFy8eVpqEeADvbT751hsxW2g ,
Last Accessed: 30.10.2019
Fig. 28: Line and Contrast, Available from https://www.pinterest.co.uk/pin/243757398562410444/?lp=true, Last Accessed: 5.11.2019
Fig. 29: Bizarro, (2009), Turns Heads to Records and Speakers Available from https://www.trendhunter.com/trends/bizarro-photography, Last Accessed: 7.11.2019
Fig. 30: Types of Frequency, Available from https://www.electrical4u.net/electrical-basic/frequency-measure-frequency/, Last Accessed: 10.11.2019
Fig. 31: Reflection of Sound Waves, Available from https://www.toppr.com/guides/physics/waves/reflection-of-sound-waves/, Last Accessed: 10.11.2019
Fig. 32: Wireless Basics: How Radio Waves Work, Available from https://www.autodesk.com/products/eagle/blog/wireless-basics-radio-waves-work/ Last Accessed: 11.11.2019
Fig. 33: Baimpakis C. (2019) Australian Pink Floyd in Manchester [Digital] Available from http://www.chriscottonart.com
Fig. 34: Crewsdon G., (2014), Mother and Daughter, [Diital Pigment Print] Available from https://www.thetimes.co.uk/article/waldemar-januszczak-art-review-gregory-crewdson-photographers-gallery-jwcnfnclk#
Fig. 35: Baimpakis C. (2019) The Gulliver in Manchester [Digital] Available fromhttp://www.chriscottonart.com
Fig. 36: Baimpakis C. (2019) The Usher Hall [Digital] Available from http://www.chriscottonart.com
Fig. 37: Baimpakis C. (2019) Apollo in Manchester [Digital] Available from http://www.chriscottonart.com
Fig. 38: Baimpakis C. (2019) The Regent Theatre in Stoke-on-Trent [Digital] Available from http://www.chriscottonart.com
Fig. 39: Baimpakis C. (2019) The Royal Hall in Harrogate [Digital] Available from http://www.chriscottonart.com
Fig. 40: Baimpakis C. (2019) The Bridgewater Hall in Manchester [Digital] Available from http://www.chriscottonart.com
Fig. 41: Baimpakis C. (2019) The King George’s Hall in Blackburn [Digital] Available from http://www.chriscottonart.com50
Fig. 42: Pink Floyd HD Another break in the wall,(1994), Concert Earls Cort London,[film still], Available from https://www.youtube.com/watch?v=WK5WLq4pBFg&fbclid=IwAR1G8x-xVeDkv4VGmkYbJHq3GRzVsOmwwJfx2cKqVM_SWlex2HlDnORr964 Last Accessed:27.12.2019
Fig. 43 – 48: Baimpakis C. (2019) Images of the first set up [Digital] (Christos Baimpakis’ own private collection)
Fig. 49 – 50: Baimpakis C. (2019) Images of the first results [Digital] (Christos Baimpakis’ own private collection)
Fig. 51: Baimpakis C. (2019) Image of the combination of two frequencies [Digital] (Christos Baimpakis’ own private collection)
Fig. 52 – 60: Baimpakis C. (2019) Images of the results after experimenting with a combination such as Perfect fifths, minor thirds, major thirds, octaves, and randomly picking notes. [Digital] (Christos Baimpakis’ own private collection)
Fig. 61 – 65: Baimpakis C. (2019) Images of the results after applying the specific frequency from sacred Frequencies. [Digital] (Christos Baimpakis’ own private collection)
Fig. 66 – 71: Baimpakis C. (2019) Images of the results after combining specific frequencies from sacred Frequencies. [Digital] (Christos Baimpakis’ own private collection)
Fig. 72 – 78: Baimpakis C. (2019) Images of the results after altering the camera settings. [Digital] (Christos Baimpakis’ own private collection)
Fig. 79 – 87: Baimpakis C. (2019) Images of the items used for the project. [Digital] (Christos Baimpakis’ own private collection)
Fig. 88 – 95: Baimpakis C. (2019) Images of the results after experimenting with laser and water. [Digital] (Christos Baimpakis’ own private collection)
Fig. 96 – 101: Baimpakis C. (2019) Images of the results after experimenting with laser and water. [Digital] (Christos Baimpakis’ own private collection)
Fig. 102 – 105: Baimpakis C. (2019) Images of the laser to capture the vibrations. [Digital] (Christos Baimpakis’ own private collection)
Fig. 106 – 111: Baimpakis C. (2019) Images of the equipment used. [Digital] (Christos Baimpakis’ own private collection)
Fig. 112 – 116: Baimpakis C. (2019) Images of the equipment used. [Digital] (Christos Baimpakis’ own private collection)
